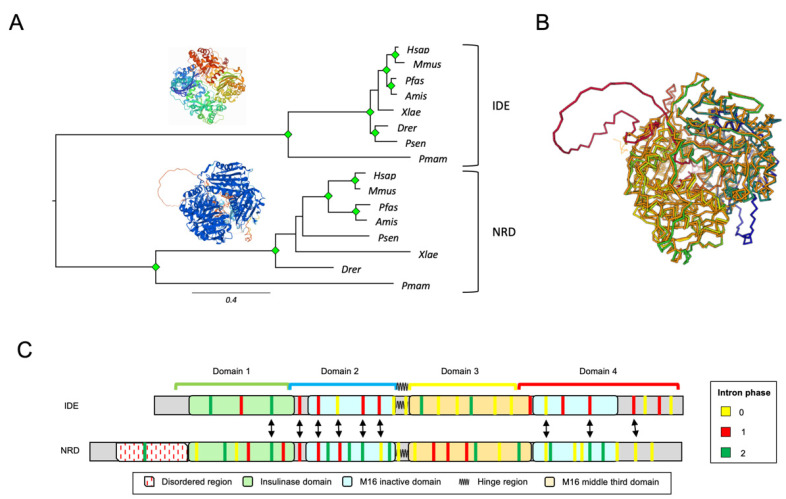
Figure 3.
IDE and NRD comparison in chordates. (A) Phylogenetic relationships of IDE and NRD in 8 selected species of Chordata. The tree was built from protein sequence-based MSAs and an ML method (substitution model: LG + G4). Protein structures depicted are 3CWW for IDE and a prediction from the AlphaFold database for NRD. Green diamonds label nodes with a bootstrap value >80%. (B) Superimposition of 3D structures of IDE (in orange) and NRD (rainbow colors) resultant from a structural alignment on the Dali Server. (C) Intronic architecture of IDE and NRD genes mapped onto a multiple protein sequence alignment in which proteins are represented by their constituent domains. Equivalent introns (with a distance less than 5 residues) are pointed out by arrows.

