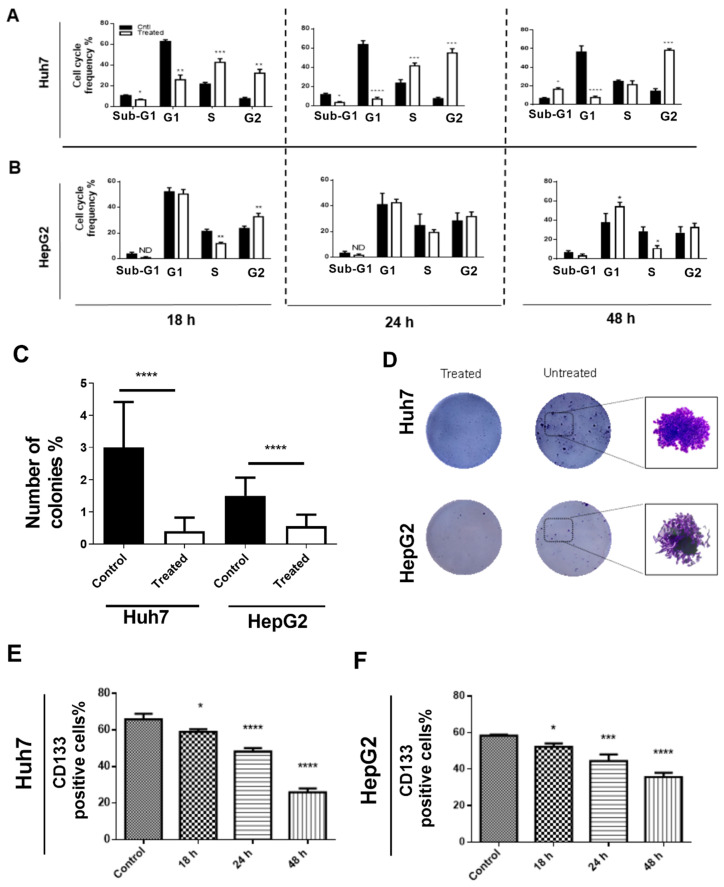
Figure 2.
Cell cycle evaluation and colony formation assay. (A,B) Flow cytometry evaluated cell cycle profile for cells treated with 37 MBq (Huh7)/55 MBq (HepG2) of 188ReO4 versus untreated group 18, 24, and 24 h post-exposure using PI/ RNase staining. The results showed that 37 MBq exposure led into significant G2/M arrest in Huh7 cells after 24 h, while, in HepG2, 55MBq exposure did not make significant changes in cell cycle phases. (C,D) Cells treated with 37 MBq (Huh7)/55 MBq (HepG2) of 188ReO4 reduced colony formation capacity. The results show an almost three-fold lower number of colonies in treated cells compared to untreated control cells. (E,F) The number of CD133 positive cells decreased significantly after treatment in a time dependent manner. Data are expressed as the mean ± SD, n = 3 (* p < 0.05, ** p < 0.01, and *** p < 0.001, **** p < 0.0001) versus the control group.

