Figure 4.
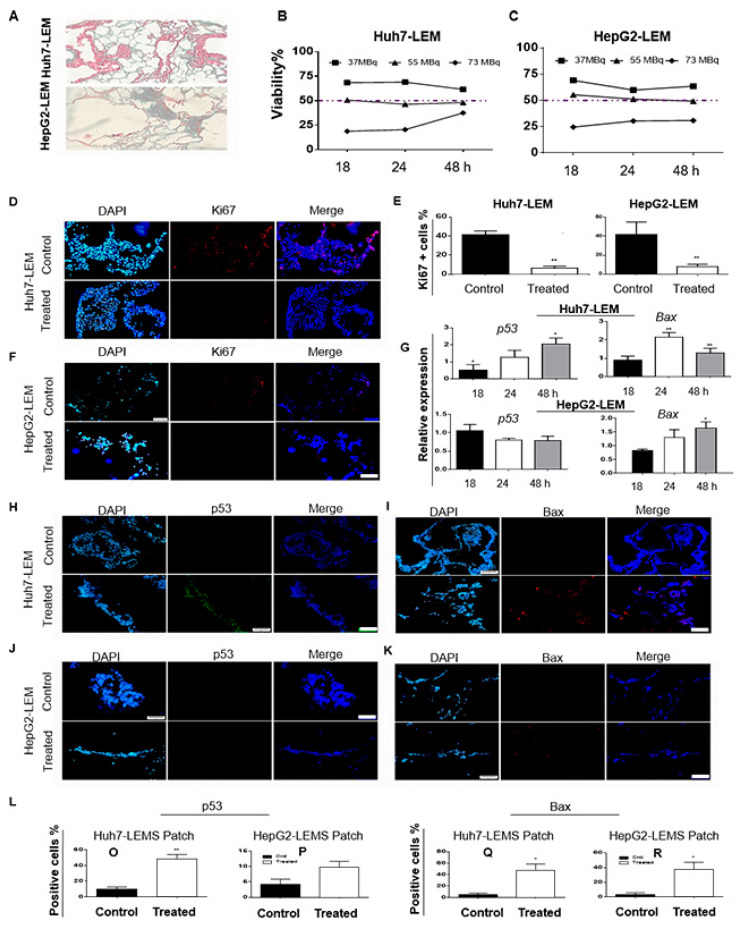
Evaluation of Huh7 and HepG2 cells in 3D LEM culture. (A) MT staining of Huh7 and HepG2 cells homing at synthesized LEM. (B,C) Viability percentage versus the control for finding the effective dose of 188ReO4 in Huh7/HepG2-LEM treated with 37, 55, and 73 MBq doses 18, 24, and 48 h post-exposure. (D–F) The Ki67-positive cells representing proliferating fraction of Huh7/HepG2-LEMs treated with 188ReO4. (G) The qPCR results for p53 and Bax relative mRNA expression in Huh7/HepG2-LEMs treated with 188ReO4 versus the control after 18, 24, and 48 h. (H–L) IF staining done to visualize p53 and Bax protein expressions in Huh7-LEM and HepG2-LEM treated with 188ReO4. Scale bars: 200 μm. Values are presented as mean ± SD, n = 3 (* p < 0.05, ** p < 0.01).

