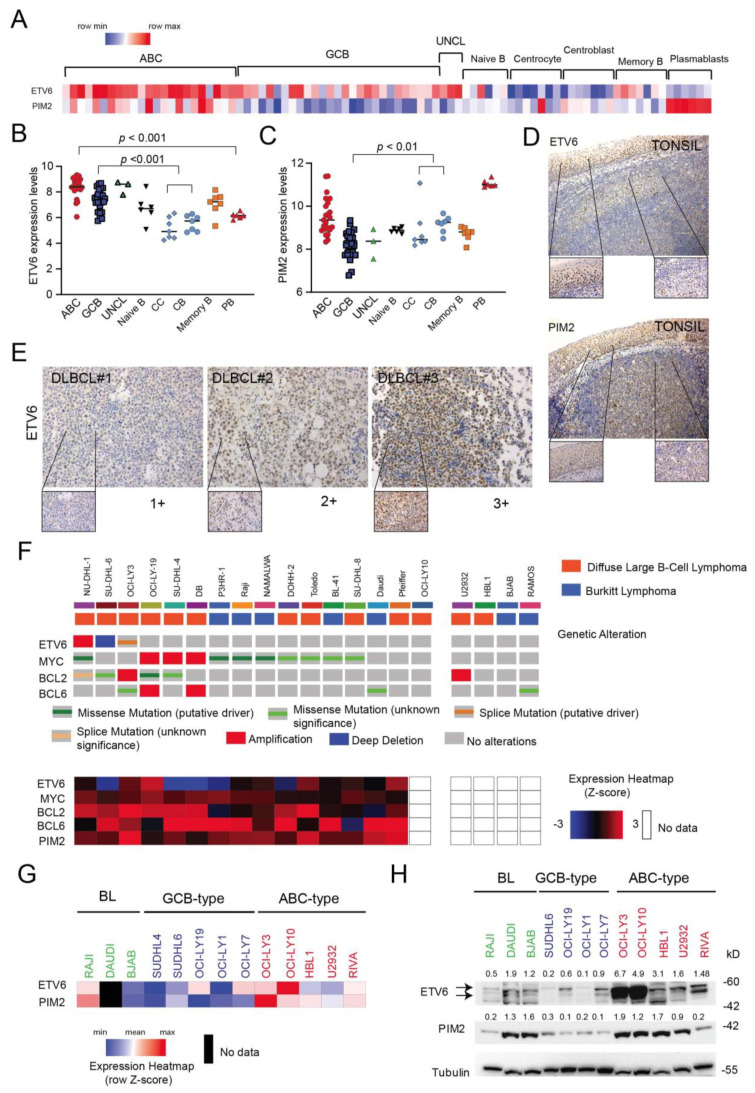
Figure 5.
ETV6 expression in malignant B-cells compared to normal B-cell subsets. (A) Heat map representation of ETV6 and PIM2 transcript levels in DLBCL samples and normal tonsil B-cell subsets [29]. (B) Comparison of ETV6 transcript levels between DLBCL subgroups (ABC, GCB and UNCL) and normal B-cell subsets obtained from tonsils. For statistical analysis, an unpaired t-test was used. (C) Comparison of PIM2 transcript levels between DLBCL subgroups (ABC, GCB and UNCL) and normal B-cell subsets obtained from tonsils. CC = centrocytes; CB = centroblasts; PB: plasmablasts. For statistical analysis, a nonparametric t-test was used. (D) ETV6 immunohistochemical staining of reactive tonsil (top): original magnification (×10) and 40× (insets). PIM2 immunohistochemical staining of reactive tonsil (top): original magnification (×10) and 40× (insets). (E) Immunohistochemical staining for ETV6 in representative cases of DLBCL patients showing low (+1), medium (+2) and high (+3) expression levels. Original magnification ×20; inset ×40. (F) OncoPrint visualization in cBioPortal of genetic alterations (top) affecting ETV6, MYC, BCL2 and BCL6 genes for selected B-lymphoma cell lines (source: Cancer Cell Line Encyclopedia (Broad, 2019) and Lymphoma cell lines (MSKCC,2020)). Heat map showing gene expression levels of selected genes is also depicted (bottom). (G) Heat map representation of relative ETV6 and PIM2 transcript levels (normalized to RPL19 housekeeping gene) in available B-cell lymphoma cell lines as determined by qRT-PCR. (H) Evaluation of ETV6 and PIM2 and protein expression levels in DLBCL cell lines of different molecular subtypes (ABC and GCB-type) and Burkitt lymphoma (BL) cell lines using immunoblotting. Tubulin is shown as loading control. Relative protein expressions (normalized to loading control) are shown on top of appropriate panels. kD = kilodaltons.

