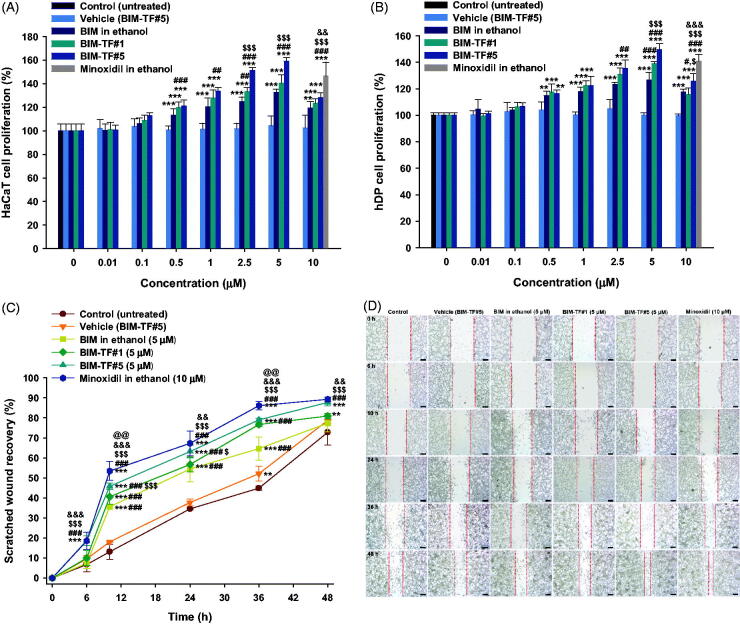
Figure 3.
Relative cell proliferation of (A) keratinocyte (HaCaT) and (B) human follicle dermal papilla (hDP) cells after incubation with bimatoprost (BIM) in ethanol, BIM topical formulations (BIM–TFs), and vehicle (BIM–TF#5 diluted to BIM concentrations of 0.01, 0.1, 0.5, 1, 2.5, 5, and 10 µM BIM), and 5% minoxidil in ethanol diluted to a concentration equivalent to that of 10 µM minoxidil. **p<.01, ***p<.001 compared to vehicle (BIM–TF#5); #p<.05, ##p<.01, ###p<.001 compared to BIM in ethanol; $p<.05, $$$p<.001 compared to BIM–TF#1; &&p<.01, &&&p<.001 compared to BIM–TF#5. Relative scratch wound recovery of hDP cells after incubation with BIM in ethanol, BIM–TF#1, BIM–TF#5, and vehicle of BIM–TF#5 diluted to a concentration equivalent to that of 5 μM BIM, and minoxidil in ethanol diluted to a concentration equivalent to that of 10 µM minoxidil. (C) Time–course curve of relative scratch wound recovery area of hDP cells. **p<.01, ***p<.001 compared to control (untreated); ###p<.001 compared to vehicle (BIM–TF#5); $p<.05, $$$p<.001 compared to BIM in ethanol (5 µM); &&p<.01, &&&p<.001 compared to BIM–TF#1 (5 µM); @@p<.01 compared to BIM–TF#5 (5 µM). Values represent means ± SDs (n = 6). (D) Representative microscope images of scratch wounds of hDP cells. Scale bar = 200 µm.

