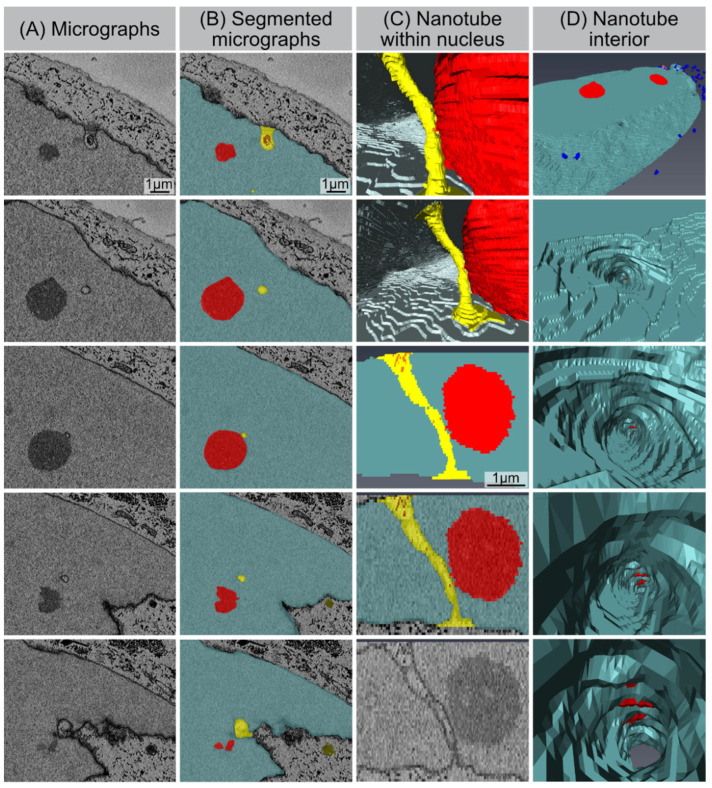
Figure 6.
Nucleo-cytoplasmic nanotube. (A) Original micrographs showing cross-sections of the nanotube. (B) Segmented micrographs for the same area: nucleus (light-blue), nucleoli (red), nanotubes (yellow). (C) Models showing nanotube’s appearance from within the nucleus (1st and 2nd image from top), segmented volume showing the nanotube from side (3rd and 4th image from top), and original micrograph of the same region. (D) Visualization of the nanotube’s interior.

