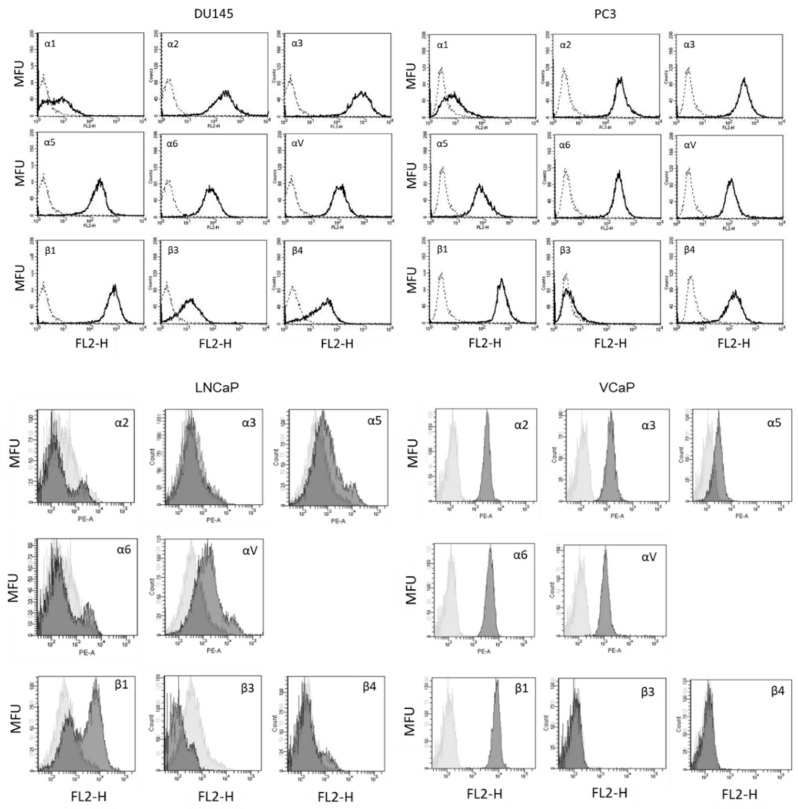
Figure 5.
Surface expression of integrin α and β subtypes on DU145, PC3, LNCaP, and VCaP cells. Counts indicate cell number; fluorescence is expressed by mean fluorescence units (MFU). One representative of three separate experiments is shown. Solid line = specific fluorescence, dotted line = isotype control.

