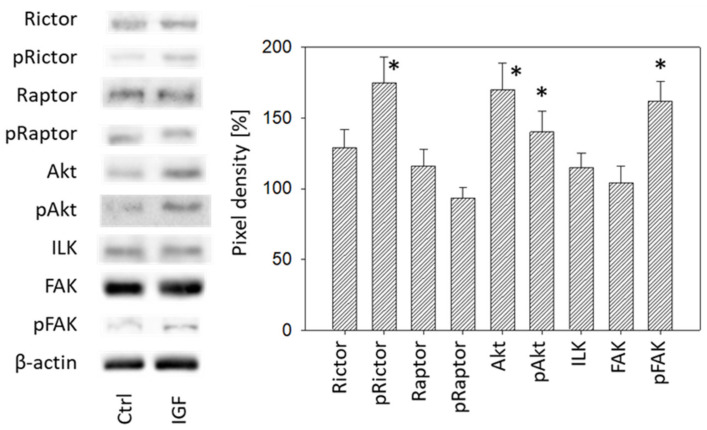
Figure 9.
Left: Protein profile of cell signaling proteins. DU145 cells were either stimulated with IGF for 24 h or received culture medium without IGF (Ctrl). One representative of three separate experiments is shown. Each protein analysis was accompanied by a β-actin loading control. One representative internal control is shown. Right: Pixel density analysis of the protein expression level of DU145 cells stimulated with IGF. The ratio of protein intensity/β-actin intensity is expressed as percentage of controls set to 100%. * indicates significant difference to controls.

