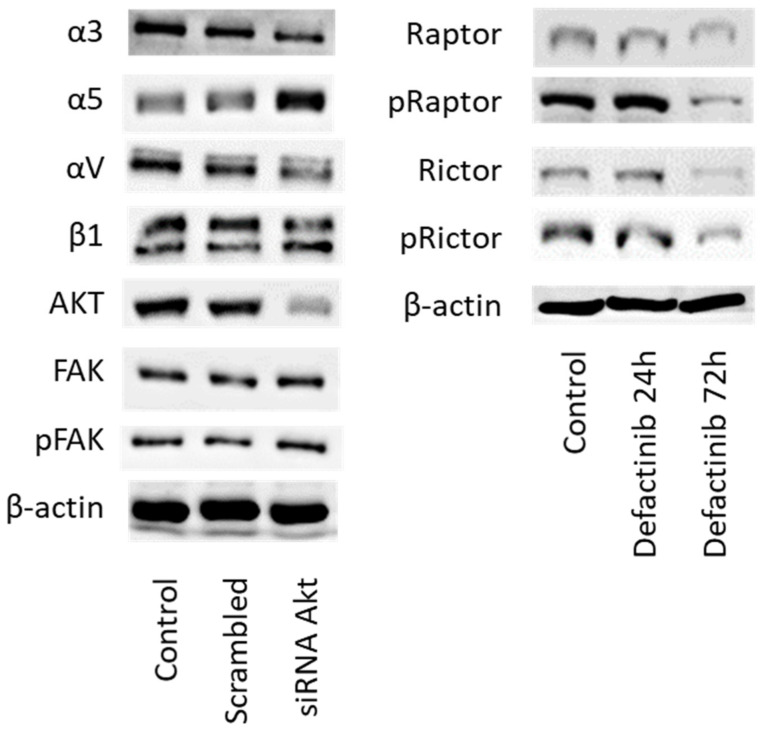
Figure 15.
(Left) Integrin subtype and FAK expression level in DU145 cells following treatment with Akt specific siRNA (versus untreated controls or scrambled siRNA). (Right) mTOR signaling in DU145 cells following defactinib treatment for 24 and 72 h. Controls remained untreated. One representative of three separate experiments is shown. Each protein analysis was accompanied by a β-actin loading control. One representative internal control is shown.

