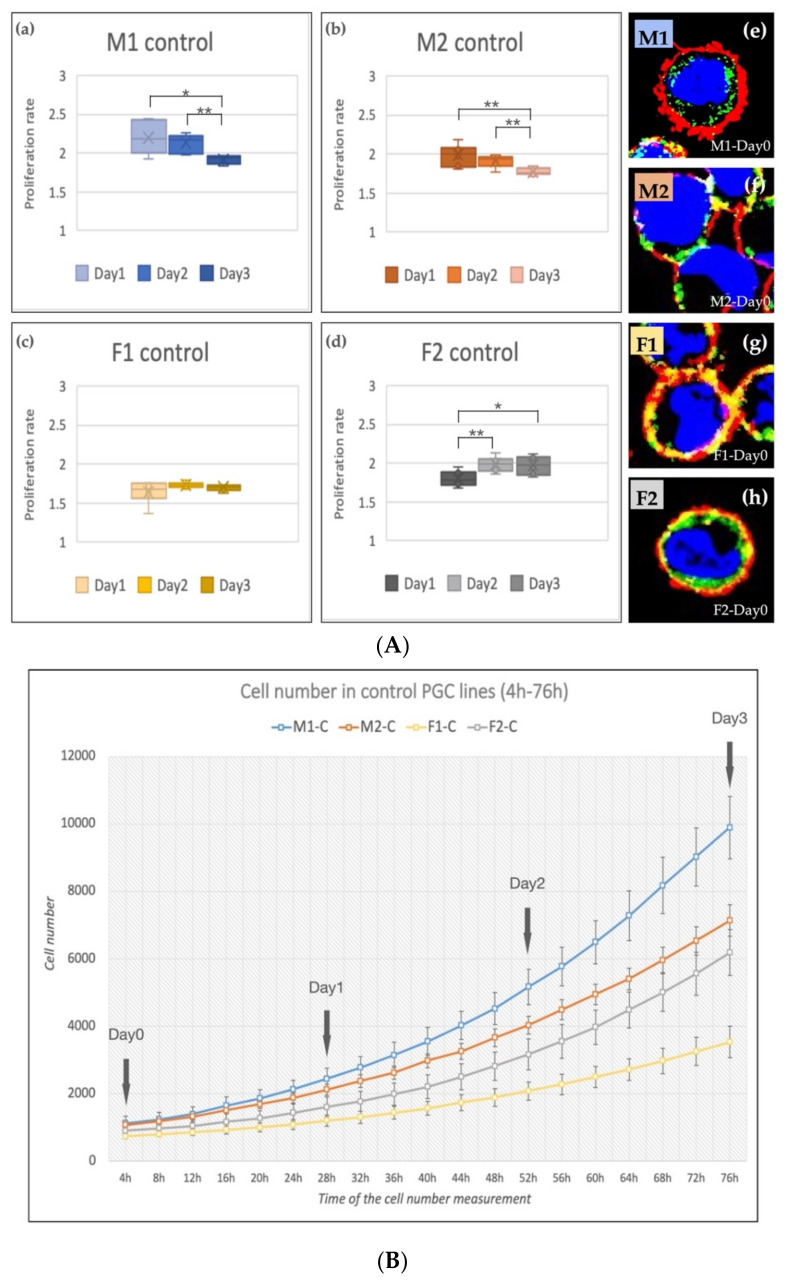
Figure 3.
(A) The proliferation rate of the control PGC lines on Day 1, Day 2 and Day 3 (a–d) and immunostaining (e–h) of the four lines are shown in the figure. The immunostaining was achieved with SSEA-1 (red), CVH (green) and TO-PRO™-3 for nuclear staining (blue). (B) Analysis of the cell number. The cell number measurements were performed every 4 h (from 4 h to 76 h). We calculated the proliferation rates on Day 1, Day 2 and Day 3 (p < 0.05 *, p < 0.01 **).

