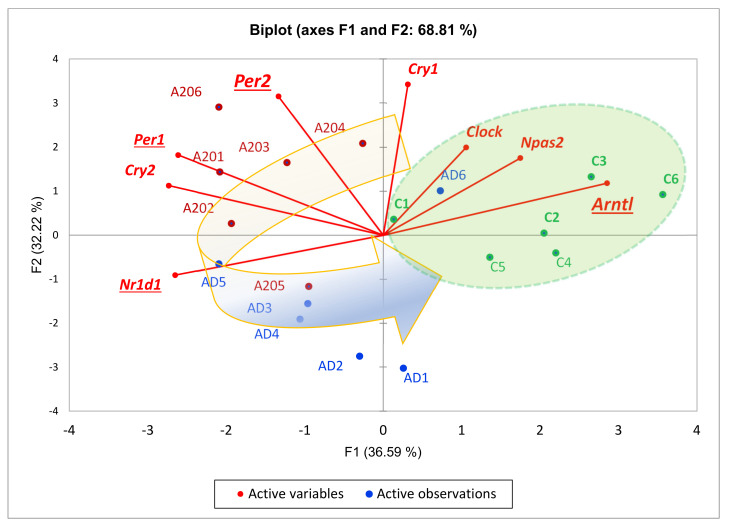
Figure 6.
Circadian rhythm TF set (8 genes; Figure 5) PCA biplot featuring a control-group-associated Arntl DEG (Figure 3A) along with experimentally confirmed (string-db) connected genes Npas2, Clock (green shaded area) that are attenuated in affected species due to repressive action of cAMP-associated Per1 expression in aggressive mice. H0: random distribution of species across plot’s 2 halves: p < 0.0024; binomial test. Each gene statistically significantly correlates with at least 2 other genes (p < 0.05) except for Clock (Table 2). Curved arrow depicts group-related sequential gene expression dynamics cycle: C->A20->AD->C. Underlined gene names indicate DEGs in any of the 3-way comparisons. Enlarged underlined genes feature differential expression in 2 comparisons: Arntl (C_AD, C_A20); Per2 (AD_A20, C_A20).

