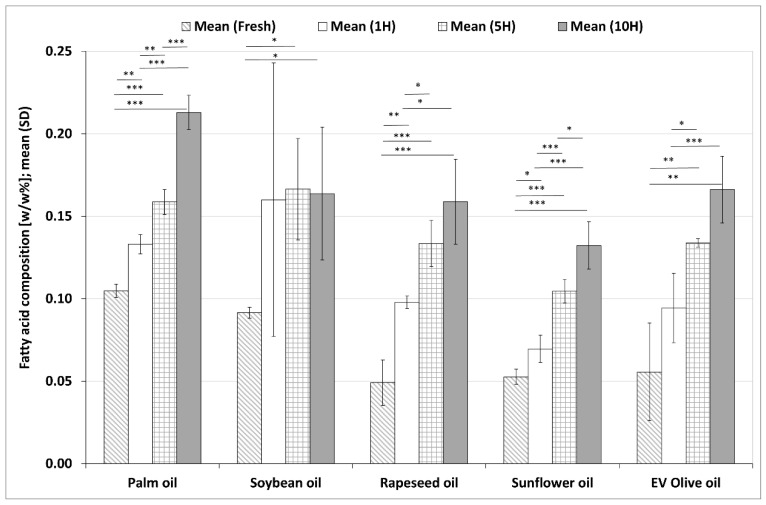
Figure 4.
Changes in total trans fatty acid (TFA) values in five different plant-based oils in fresh samples and after one (1H), five (5H) and ten heating sequences (10H). Each column shows the mean (SD) data of six different chromatograms. Asterisks denote statistically significant differences between the different time points in the same oil; *: 0.01 ≤ p < 0.05; **: 0.001 ≤ p < 0.01; ***: p < 0.001. EV olive oil: extra virgin olive oil.

