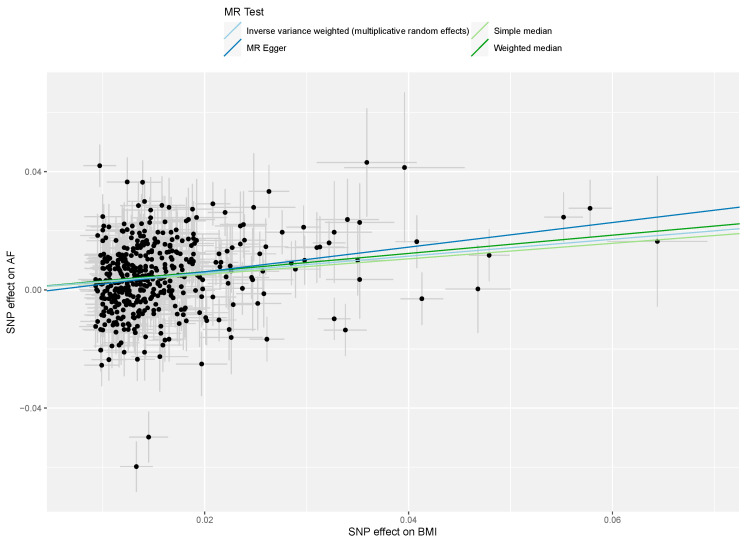
Figure 4.
Mendelian randomisation (MR) scatter plot of genetic associations between body mass index (BMI) and atrial fibrillation (AF). The genetic association and corresponding 95% confidence interval (CI) for each instrumented single-nucleotide polymorphism (n = 453) with BMI (x-axis, units of kg/m2) and AF (y-axis, units of log odds ratio atrial fibrillation liability) are plotted. The gradient of each line represents the MR estimate for the corresponding model.

