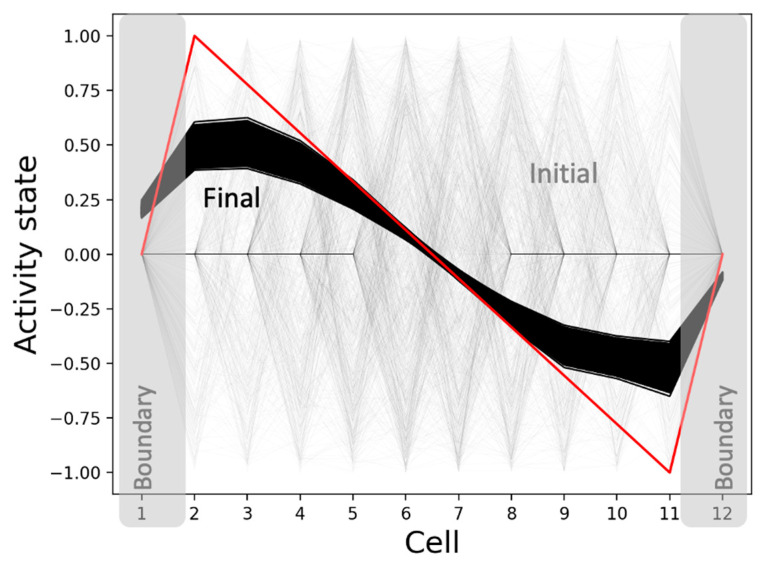
Figure 9.
The pattern attractor-space of the activity state. The model converges to patterns (black) that are qualitatively similar to the target pattern (red) when started from a set of 1000 random initial conditions (grey). The initial conditions specifically involved a randomized initial number of ‘active’ cells whose activity states were drawn from the interval [−1, 1] and boundary-marker states from the interval [1, 2] with uniform probabilities. In the case of the ‘non-active’ cells, the activity states were set to 0 and the boundary-marker states were set to 2. The internal controller states were set to 0 in both cases.

