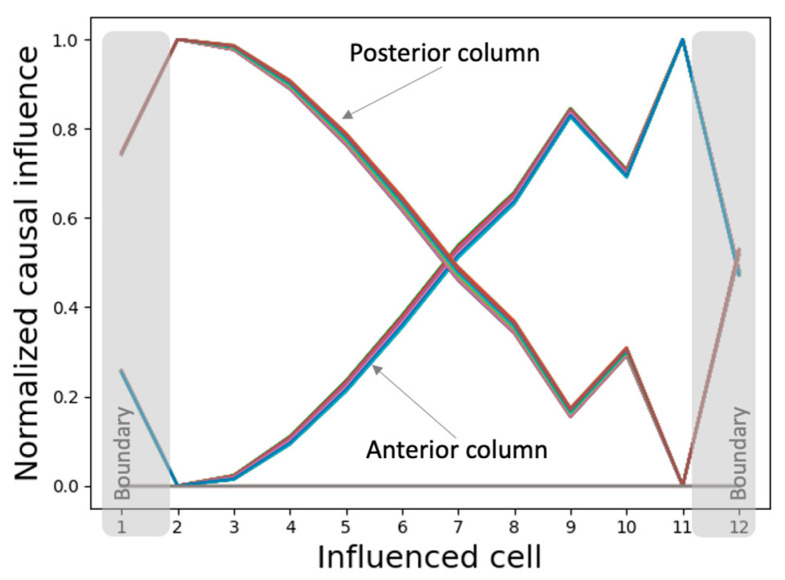
Figure 12.
Individual nodes in the intrinsic controller network of every cell possess information about the network-level activity pattern that they control. Each line in the plot represents the normalized causal influence exerted by the initial state of a single internal controller node in a specific cell over the asymptotic activity states of the (influenced) cells, that is, it is the normalized vector a specific controller node in the influencing cell where, .

