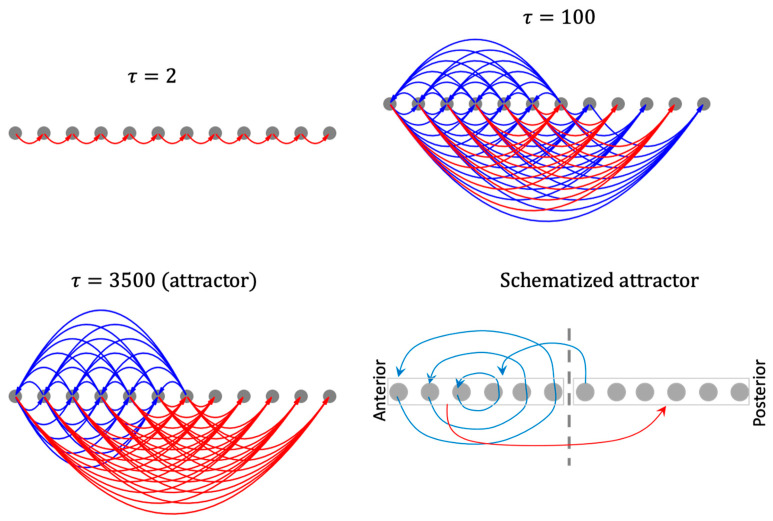
Figure 13.
Causal network integration behind the network activity pattern developed under homogeneous initial conditions. An arrow from cell to cell represents the causal influence where is a statistical outlier in the set . Blue links represent positive influence and red links represent negative influence. Multiple arrows originating from a cell may be associated with distinct intrinsic controller nodes of the originating cell.

