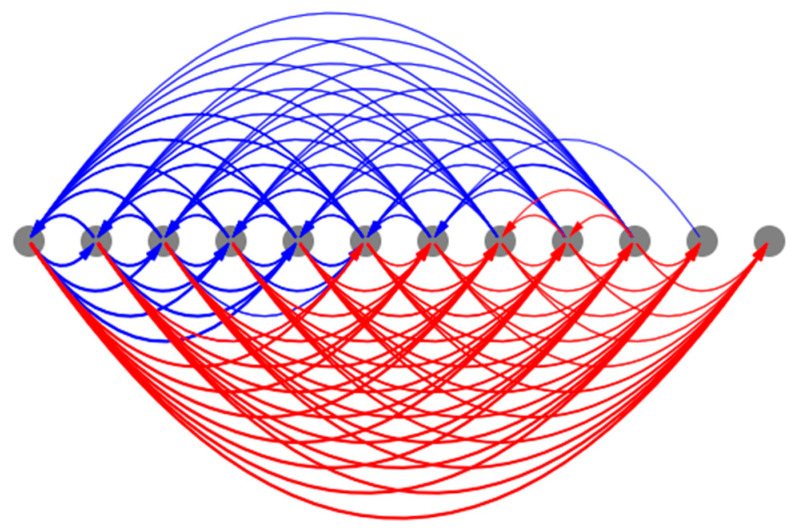
Figure 15.
The mean causal network attractors associated with the network activity patterning. The thickness of the edges represents the frequency with which they appear in the set of attractors. The initial conditions that were used here are the same as those described in Figure 9.

