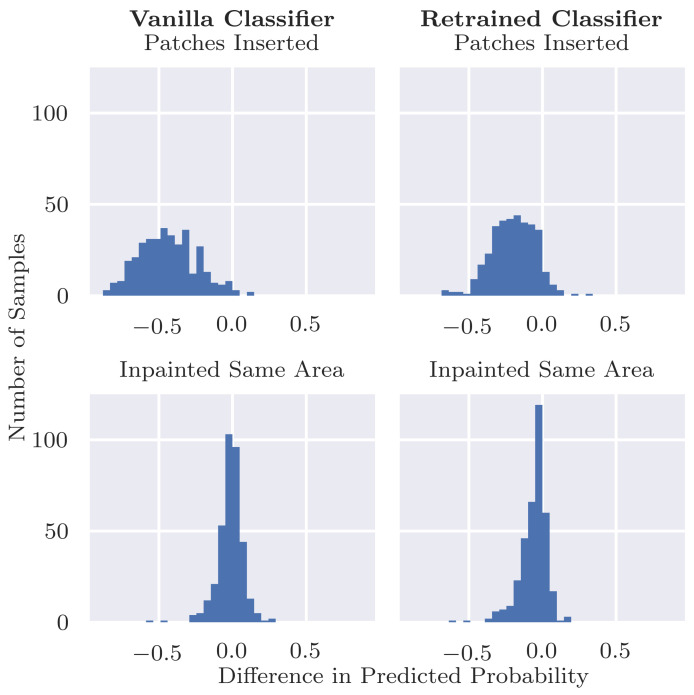
Figure 8.
Differences in from the original malignant images after inserting patches (top row) or inpainting the same area as the patches (bottom row). The changes in probabilities for the inpainted images are much closer to zero than for the images with inserted patches, indicating that the patches themselves are causing the drop in predicted probability rather than the area that they are covering.

