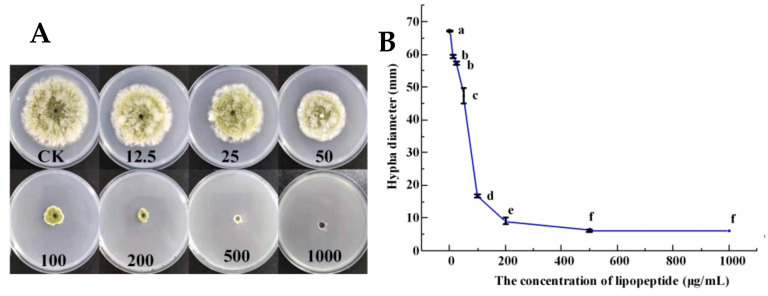
Figure 4.
The changes in growth diameter and inhibition rate of A. flavus under the effect of the control group (SDW) and test group (12.5–1000 µg/mL, LPs) were treated, respectively. (A) Colony morphology of A. flavus grown on media containing different concentrations of LPs. (B) Colony diameter of A. flavus after treating with LPs. Vertical bars represent standard errors of the mean. Different letters indicated significant differences (LSD test, p < 0.05).

