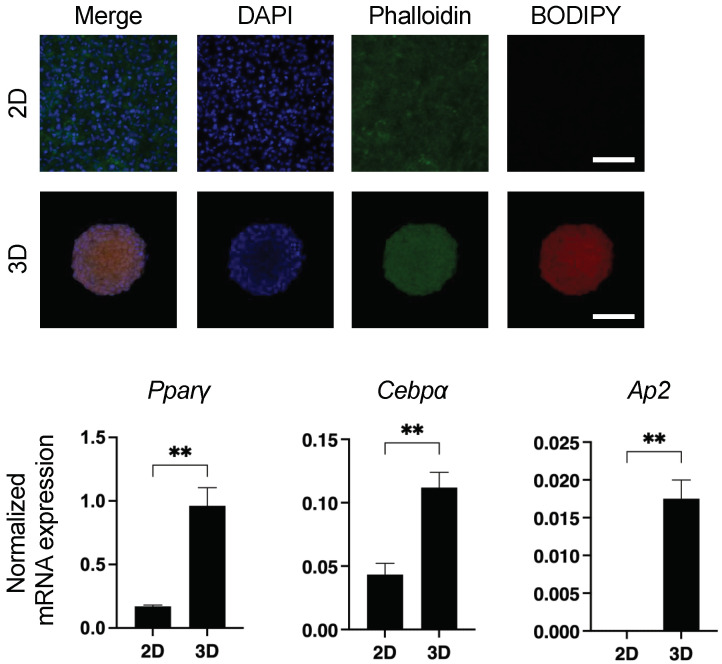
Figure 1.
Spontaneous adipogenic differentiation in 3D 3T3-L1 spheroids. Representative images of lipid staining of 2D- and 3D-cultured 3T3-L1 cells with BODIPY, DAPI, and phalloidin are shown in upper panels (scale bar; 100 μm). In the lower panels, 2D- and 3D-cultured 3T3-L1 cells at Day 7 were subjected to qPCR analysis of Ppaγ, Cebpa, Ap2 (Fabp4), AdipoQ, and leptin, and the resulting plots of Pparγ, Cebpa, and Ap2 are shown (AdipoQ and leptin expressions were not detected in both 2D and 3D). All experiments were performed in duplicate using fresh preparations consisting of 5 or 16 of 3D spheroids each for lipid staining or qPCR analysis, respectively, or 2D-cultured cells (n = 4 wells from 6 well culture dish) for both analyses. Data are presented as arithmetic mean ± standard error of the mean (SEM). ** p < 0.01 (unpaired t-test).

