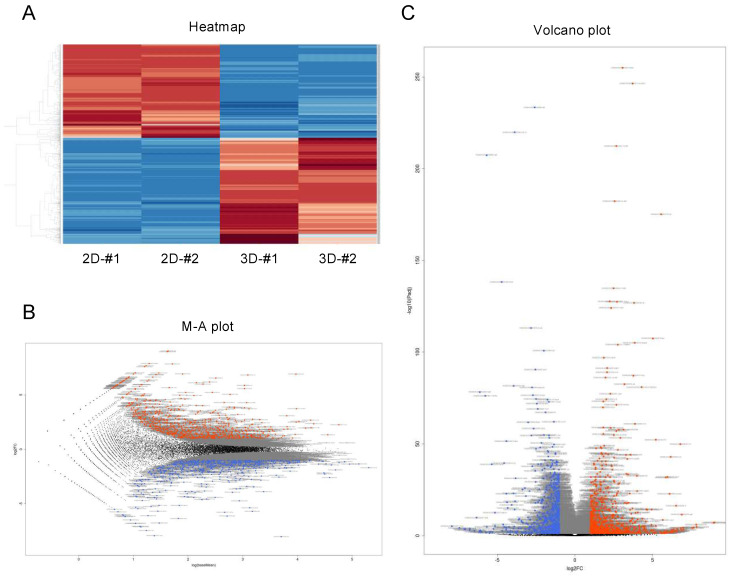
Figure 2.
Differentially expressed genes (DEGs) between 2D- and 3D-cultured 3T3-L1 cells. Genes that are expressed differentially between 2D- and 3D-cultured 3T3-L1 cells were demonstrated by a hierarchical clustering heatmap (A), an M–A plot (B), and a volcano plot (C). M–A plot represents relationship between mean expression values (log (base mean); x axis) and magnitude of gene expression change (log2 of fold change; y axis), and volcano plot represents the relationship between the magnitude of gene expression change (log2 of fold change; x axis) and statistical significance of this change (−log10 of false discovery rate (FDR); y axis). Colored points represent differentially expressed genes (cutoff FDR < 0.05) and/or the magnitude of change ≥2 that are either overexpressed (red) or underexpressed (blue) in 2D-cultured, compared with 3D-cultured 3T3-L1 cells.

