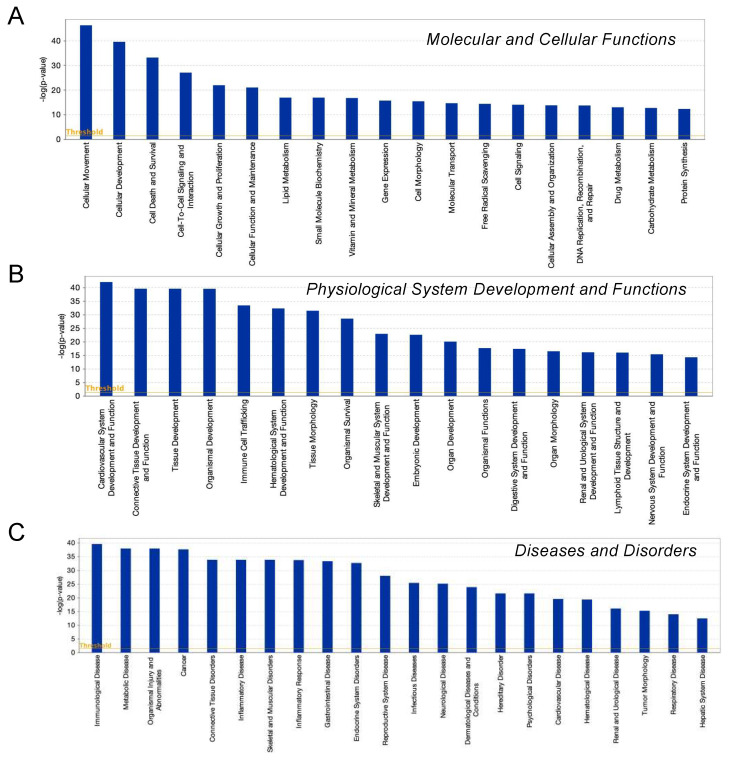
Figure 6.
IPA analysis of DEGs. Overlapping canonical 25 upregulated pathways were estimated by the IPA analysis. Among three biophysiological categories, molecular and cellular functions (A), physiological system development and function (B), and diseases and disorders (C), the bars correspond to the top 18–22 canonical pathways that surpassed the Ingenuity statistical threshold using the Benjamini–Hochberg multiple testing correction of Fisher’s exact test.

