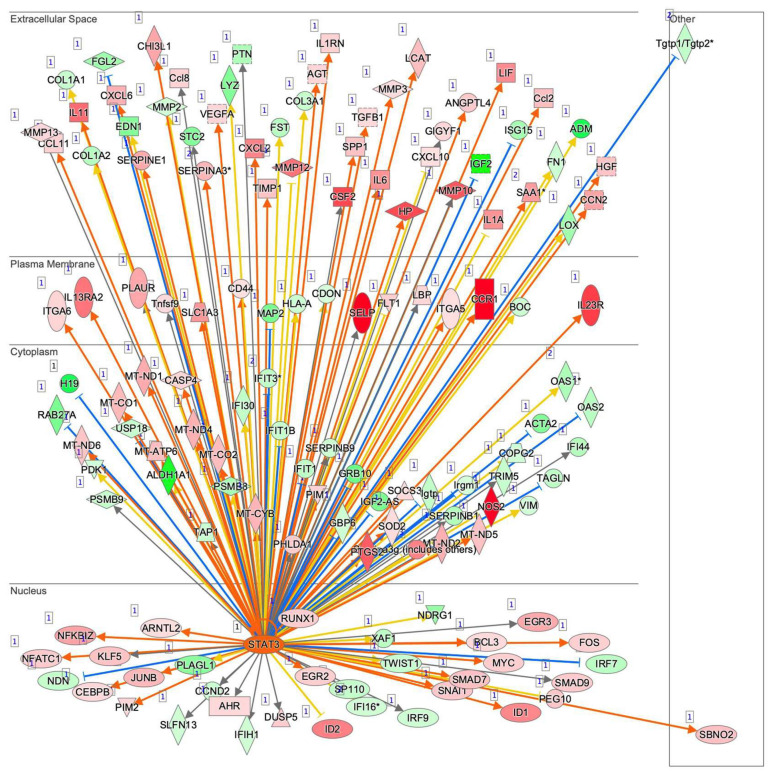
Figure 7.
Upstream regulator analysis by IPA. Upstream analysis in IPA identified TGFβ1, STAT3, IL6, AGT, FOS, and MYC as master regulators. The graphs and the networks of each regulator were obtained through the use of IPA (QIAGEN Inc., https://www.qiagenbioinformatics.com/products/ingenuity-pathway-analysis, accessed on 3 November 2021). Among these, the STAT3 network is demonstrated, and others are shown in Figure S2. Prediction legend is shown in Figure S1.

