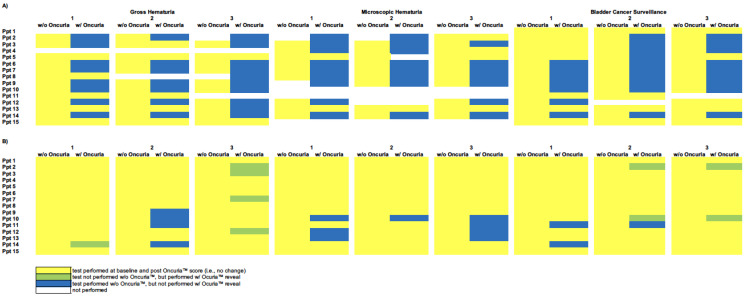
Figure 2.
Heat maps representing the total number of diagnostic tests. This figure indicates the clinical decisions for the retrospective cases without (w/o) and with (w/) Oncuria™ results. Panel (A) baseline number of urine-based procedures and changes from baseline after presenting the results of Oncuria™. Rows represent participant physicians. Columns represent patients, w/o and w/Oncuria™ results. Each cell represents a patient–physician decision node. Yellow represents baseline decision and no change after disclosing Oncuria™ score. Green represents test not performed prior to Oncuria™ results disclosure but performed w/Oncuria™ results disclosure. Blue represents test performed prior to Oncuria™ results disclosure, but not performed w/Oncuria™ results disclosure. White indicates that no test was performed. Panel (B) baseline number of invasive and/or imaging procedures and changes from baseline after presenting the results of Oncuria™. Rows represent participant physicians. Columns represent patients, w/o and w/Oncuria™ results. Each cell represents a patient–physician decision node. Yellow represents baseline decision and no change after disclosure Oncuria™ score. Green represents test not performed prior to Oncuria™ data disclosure but performed w/Oncuria™ data disclosure. Blue represents test performed prior to Oncuria™ results disclosure, but not performed post-Oncuria™ results disclosure. White indicates that no test was performed.

