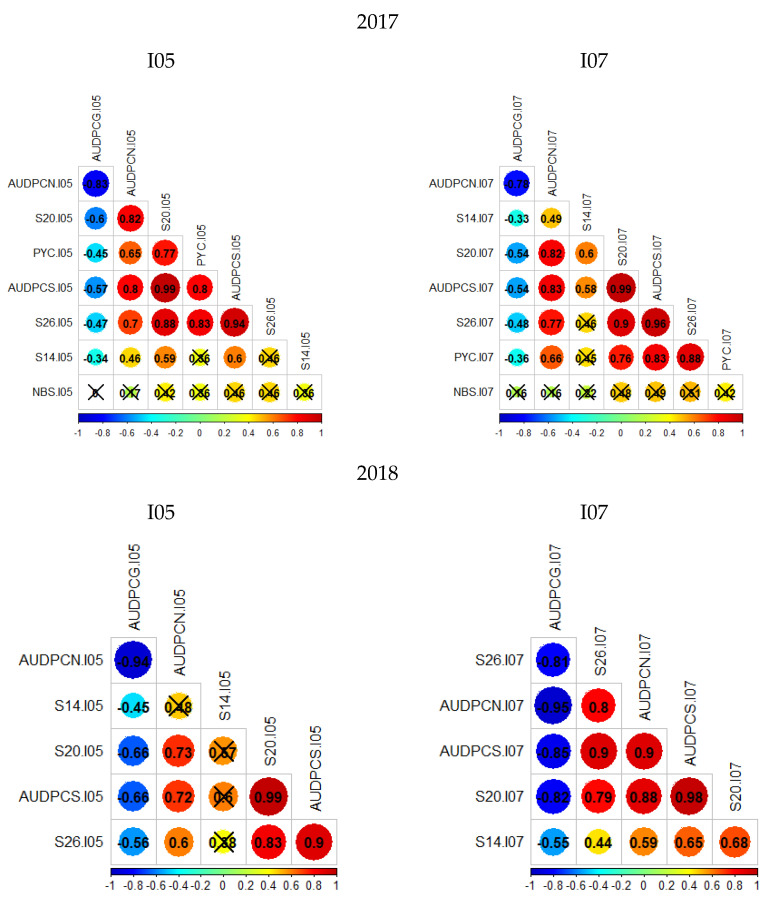
Figure 1.
Bravais–Pearson correlograms for the four datasets; crossed out correlation values are not statistically significant (p-value < 0.05). The left column presents the phenotypic trait correlations for RxCS inoculated with I05, the right presents the phenotypic trait correlations for RxCS inoculated with I07. PYC is the pycnidia density. NBS is the number of spores per pycnidiospore. AUDPCG is the area under the disease progress curve for the green leaf area. AUDPCN is the area under the disease progress curve for the necrotic leaf area. AUDPCS is the area under the disease progress curve for the sporulating leaf area. S14, S20, and S26 are the sporulating leaf area at 14, 20, and 26 days post-inoculation respectively.

