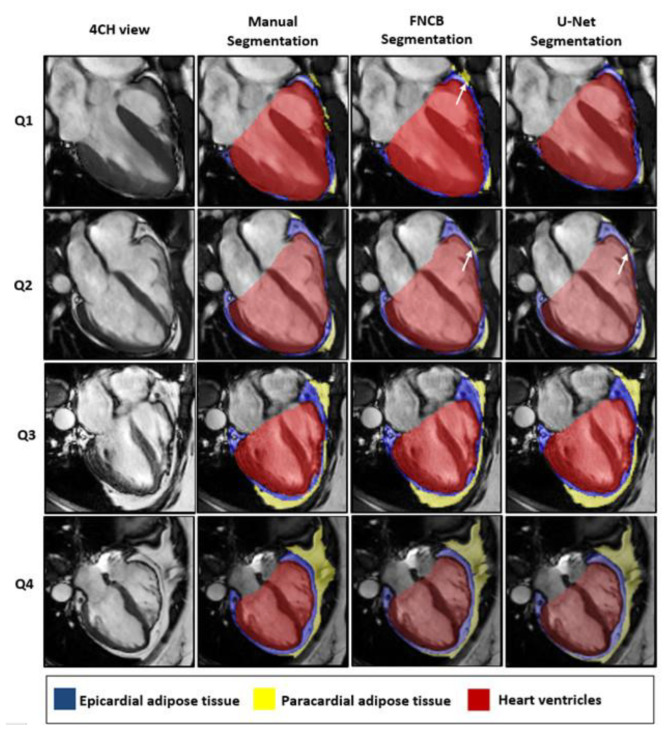
Figure 4.
Representative segmentation results for each population defined by quartile of EAT area. Images were cropped around the heart for visualization. White arrows point out discrepancies between manual and automatic segmentations. As detailed in the methods, only periventricular EAT was segmented.

