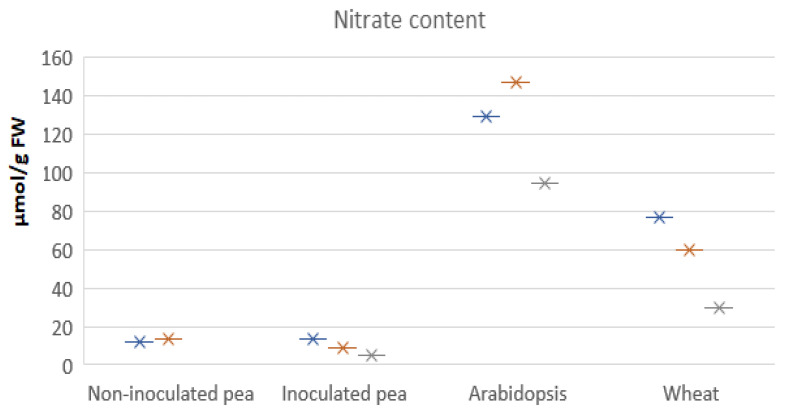
Figure 2.
NO3− concentrations in shoots of pea [25,26,27], A. thaliana [11,16,28] and wheat [29,30,31]. The tissue NO3− concentrations, plotted using star symbols, were collected and pooled from these publications (Supplemental Table S1). FW: fresh weight. Blue, orange and grey stars indicate data from different publications.

