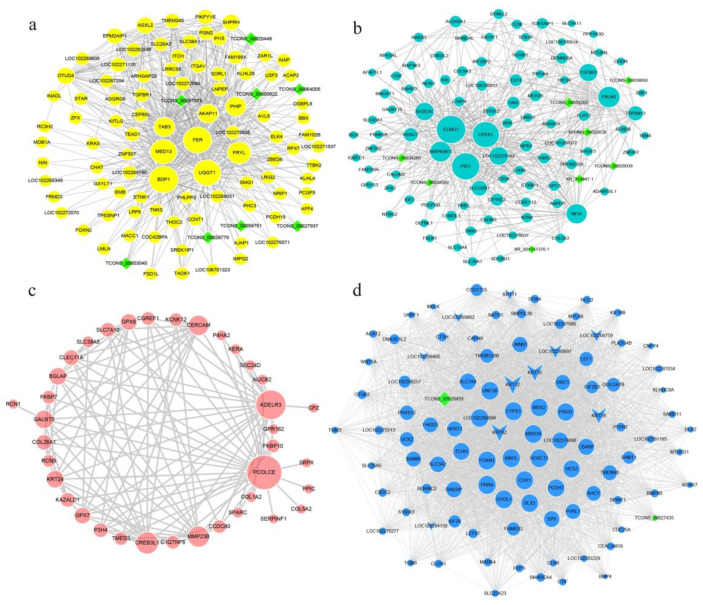
Figure 3.
The co-expression network of the genes in top 100 connectivity in the key four modules. The networks are represented with their corresponding module colors, including the yellow, turquoise, red, and blue module networks (a–d). Genes in the red module network are less than 100 that were all exhibited. Circle represents mRNAs, diamond represents lncRNAs, the V shape in the blue network represents the keratins. The size of nodes represents the connectivity of genes in the co-expression network—the larger the nodes, the higher the connectivity and the more critical it is in the network and could be used as hub genes.

