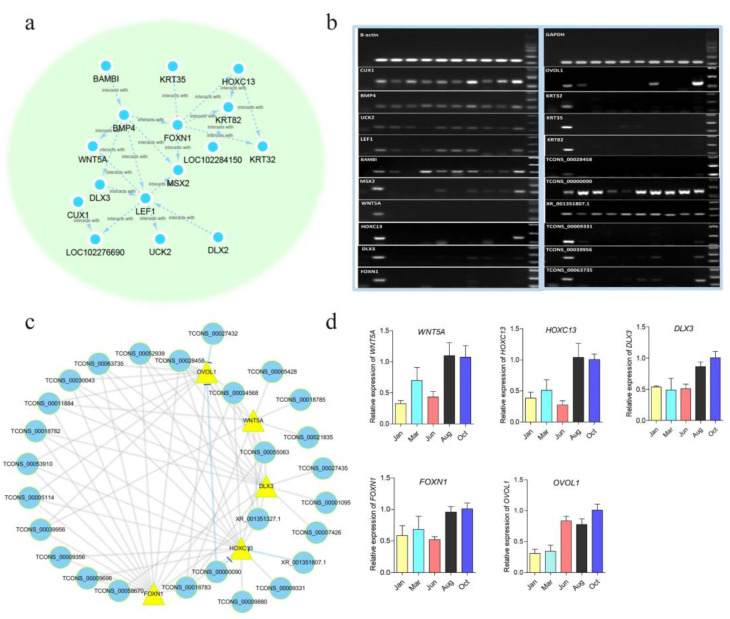
Figure 4.
Analysis of PPI and expression characteristics of the hub genes in the blue module. (a) A subnetwork of PPI analysis result for the top 100 genes in the blue module. (b) PCR detected the tissue specific of a part of hub genes in the blue module network. The lanes from left to right represent the negative control, skin, small intestine, heart, liver, spleen, lungs, kidney, fat, muscle, testis, and 2000 Marker. (c) The interaction network of five mRNAs that specifically expressed in skin with its associated lncRNAs, which was analyzed by the Pearson correlation coefficient (Pearson correlation ≥0.90 or ≤0.90) and visualized by Cytoscape. The circles in blue represent lncRNAs and the triangles in yellow represent the mRNAs. The lines in blue and the arrows indicate negative effect, and others represent positive regulation. (d) RT-qPCR results for WNT5A, HOXC13, DLX3, FOXN1, and OVOL1 during the HFs cycle of yak.

