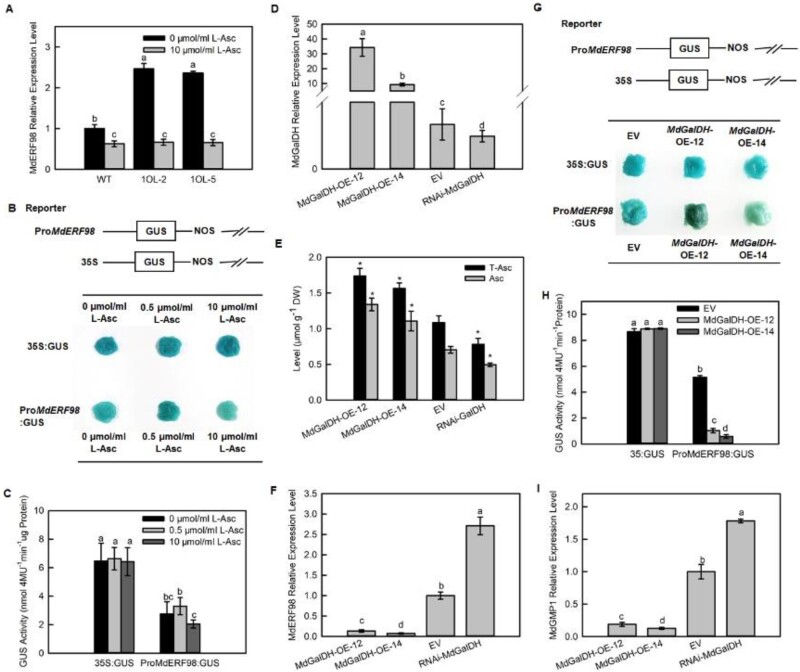
Figure 7.
MdERF98 transcript levels are regulated by feedback from Asc levels. A–C, MdERF98 transcript levels change with exogenous Asc concentration. A, Relative expression levels of MdERF98 transcripts in leaves of WT and MdAMR1L1 overexpression lines treated with exogenous L-Asc. One-month-old WT and MdAMR1L1 overexpression (1OL-2 and 1OL-5) apple seedlings grown in tissue culture were treated with exogenous 10 μmol/mL L-Asc or 0 μmol/mL L-Asc, as control, for 12 h. The value of WT-0 μmol/ml L-Asc was set to “1”. B and C, GUS staining and activity to analyze MdERF98 transcript levels in response to changes in exogenous Asc concentration. The ProMdERF98:GUS fusion protein and 35S:GUS (control) were transiently expressed in apple fruit calli of WT “WangLin”, then the transgenic calli were treated with 0, 0.5, or 10 μmol/mL L-Asc for 6 h. D–H, MdERF98 expression responded to increasing endogenous Asc levels. D, Relative expression levels of MdGalDH in apple fruit calli of EV and MdGalDH overexpression (MdGalDH-OE-12/14) and MdGalDH RNAi transgenic lines (RNAi-MdGalDH). The expression of MdGalDH in apple fruit calli of WT “WangLin” was increased or decreased by Agrobacterium infection as described in “Materials and Methods”. E, Levels of Asc in apple fruit calli of EV and MdGalDH overexpression and MdGalDH RNAi transgenic lines. F, Relative expression levels of MdERF98 in apple fruit calli of EV and MdGalDH overexpression and MdGalDH RNAi transgenic lines. G and H, GUS staining and activity to analyze the transcription of MdERF98 in response to MdGalDH overexpression. The ProMdERF98:GUS fusion protein and 35S:GUS (control) were transiently expressed in EV and MdGalDH overexpression transgenic lines. I, Expression levels of MdGMP1 in apple fruit calli of EV and MdGalDH overexpression and MdGalDH RNAi transgenic lines. The expression levels of MdERF98, MdGalDH, and MdGMP1 were investigated by qRT-PCR. For each sample, transcript levels were normalized with those of MdActin. Relative expression levels for each gene were obtained via the ΔΔCT method. The value of EV was set to “1”. Bars represent the mean value ±se (n = 3). Lowercase letters/asterisks indicate significantly different values (P < 0.05, one-way ANOVA test or independent t tests). EV, empty vector; DW, dry weight.

