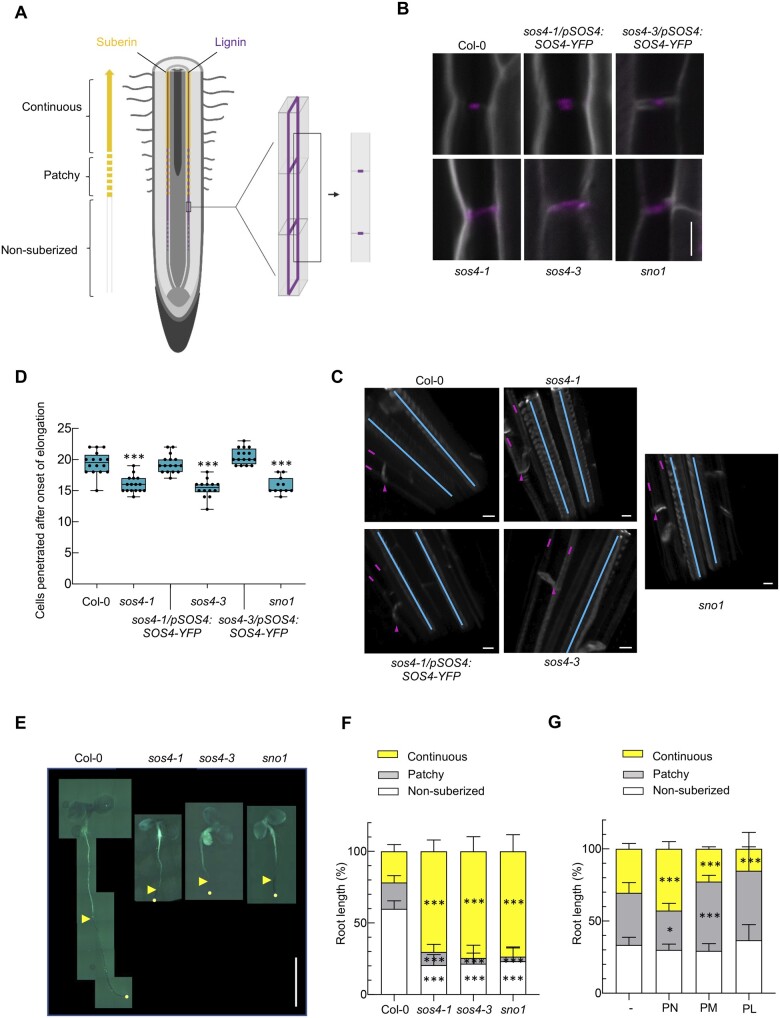
Figure 6.
Lignification and suberization in roots of sos4 compared with wild type. A, Schematic representation of the root showing differentiation, lignification, and suberization zones. Magenta represent Casparian strips, yellow lines are suberin lamellae. Schematics are indicating the position of optical sections in a 3D illustration (middle) and in a median illustration (right). B, Lignin accumulation patterns at median positions. Lignin and cellulosic cell walls of 3-d-old seedlings grown in sterile culture medium in 16-h light (120 µmol photons m−2 s−1 at 21°C), 8-h dark (at 18°C) cycles are stained with Basic Fuchsin and Calcofluor White, shown in magenta and white, respectively. Images are representative of at least eight analyzed seedlings. The scale bar represents 5 µm. C, 3D views showing xylem poles (blue lines) and endodermal cells (magenta lines and arrows indicate longitudinal and transverse deposition of lignin, respectively). The scale bar represents 5 µm. D, PI penetration assay. Scoring of number of cells after the onset of cell elongation until the PI signal is excluded from the inner side of the endodermis. The number of endodermal cells was scored from the onset of cell elongation (defined as endodermal cell length being more than two times the width in the median, longitudinal section) until PI could stain the inner endodermal cell wall. For each genotype, at least 11 roots of 3-d-old seedlings grown in sterile culture medium in 16-h light (120 µmol photons m−2 s−1 at 21°C), 8-h dark (at 18°C) cycles were tested and showed similar results in two independent experiments. The data represent the mean ± sd (N ≥ 11). Asterisks indicate significance by one-way ANOVA tests for P-values < 0.001. A separate ANOVA was used for each line in comparison with the wild type. Data are presented as a box plot, where the line indicates the median, the box indicates the first and third quartiles, and the whiskers indicate ± 1.5 × interquartile range, outliers are not indicated on the plot. E, Suberization pattern of 3-d-old seedlings grown in sterile culture medium in 16-h light (120 µmol photons m−2 s−1 at 21°C), 8-h dark (at 18°C) cycles. The scale bar represents 0.5 cm. Images were digitally extracted for comparison; adjustments to brightness, contrast, or color balance were made uniformly across the entire image. F, Quantification of (E). The data represent the mean ± sd (N ≥ 17). The asterisks indicate significance by one-way ANOVA tests for P values < 0.001. A separate ANOVA was used for each line in comparison with the wild type. G, Quantification of the suberization pattern of 3-d-old wild type seedlings grown in sterile culture medium in the absence or presence of either pyridoxine (PN), pyridoxamine (PM), or pyridoxal (PL) (200 µM in each case). The data represent the mean ± sd of three biological replicates (each comprising ≥8). The asterisks indicate significance by one-way ANOVA tests (*P-value < 0.05, ***P-value < 0.001). A separate ANOVA was used for each line in comparison with the wild type.

