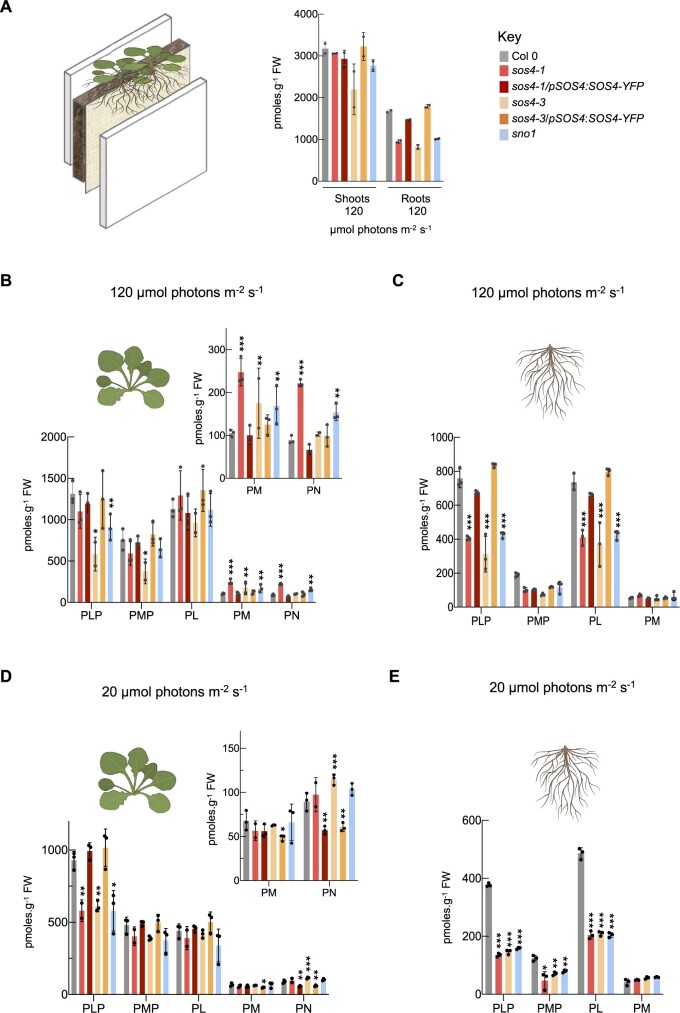
Figure 7.
HPLC profiling of vitamin B6 content of plants grown in rhizoboxes. A, Left side, a scheme of the rhizobox system used. The soil and a membrane are layered between two perspex plates. Seeds are sown on the top at the membrane side and do not touch the soil. Right side, total vitamin B6 content of shoots and roots of 2-week-old plants grown in rhizoboxes in 16-h light (120 µmol photons m−2 s−1 at 21°C), 8-h dark (at 18°C) cycles. The key indicates the color coding used for each line. B, Individual B6 vitamer content in shoots of plants grown as in (A). The individual vitamers are pyridoxal 5′-phosphate (PLP), pyridoxamine 5′-phosphate (PMP), pyridoxal (PL), pyridoxamine (PM), and pyridoxine (PN). To aid visualization PM and PN contents are shown as an inset on a smaller scale. C, Individual B6 vitamer content in roots of plants grown as in (A). Vitamers as in (B). D, Individual B6 vitamer content in shoots of 2-week-old plants grown in rhizoboxes in 16-h light (20 µmol photons m−2 s−1 at 21°C), 8-h dark (at 18°C) cycles. Vitamers and inset as in (B). E, Individual B6 vitamer content in roots of plants grown as in (D). Vitamers as in (B). The data represent the mean ± sd of three biological replicates (each comprising ≥20 plants collected from three rhizoboxes). Asterisks indicate significance by one-way ANOVA test (*P-value < 0.05, **P-value < 0.01, ***P-value < 0.001). A separate ANOVA was used for each line in comparison with the wild type.

