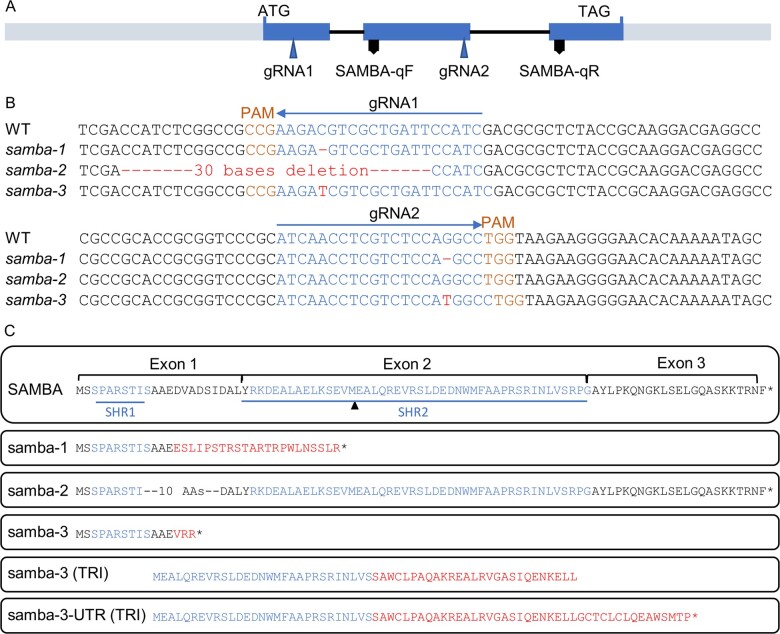
Figure 1.
samba mutants obtained through CRISPR/Cas9 gene editing. A, Structural representation of the maize SAMBA gene showing the target sites of the two gRNAs. B, The gRNA sequences (blue), PAM (orange), and mutation sites (red) of samba alleles. C, The amino acid sequences of SAMBA WT and putative samba mutant isoforms from translation re-initiation (TRI). SAMBA homology region 1 (SHR1) and SHR2, as defined by Eloy et al. (2012) are marked in green and the missense AAs are indicated in red. SAMBA-qF and SAMBA-qR indicate the position of the forward and reverse primers, respectively, used for SAMBA RT-qPCR. Asterisk represents a stop codon.

