Figure 5.
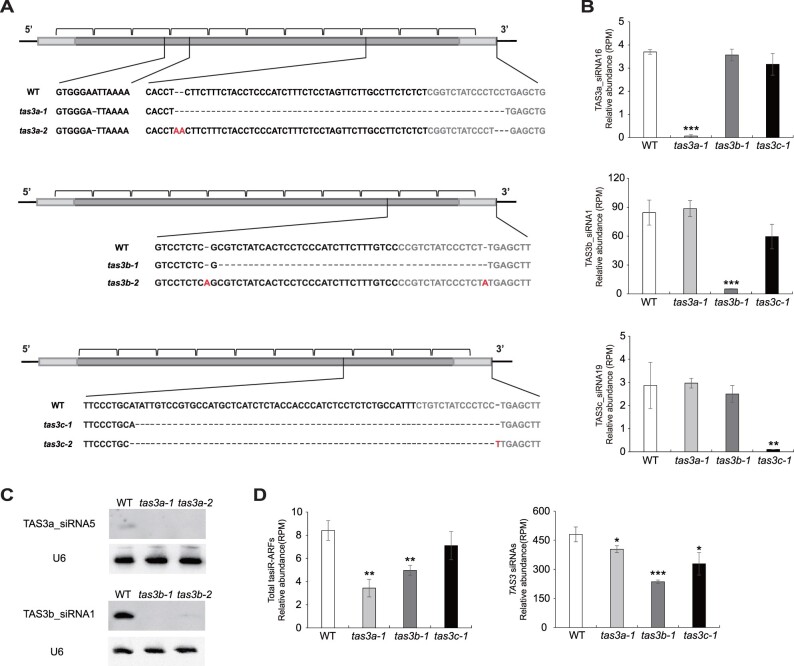
Generation of rice tas3a/b/c mutants by CRISPR/Cas9. A, Schematic illustration of the rice tas3a-1, tas3a-2, tas3b-1, tas3b-2, tas3c-1, and tas3c-2 mutations. The TAS3 transcripts are diagramed as rectangles with the miR390 binding sites indicated in light gray. The brackets indicate 21-nt phased siRNAs. The inserted and deleted sequences are labeled in red and represented by dotted lines, respectively. B, Abundance of three representatives TAS3 siRNAs in WT, tas3a-1, tas3b-1, and tas3c-1. Note that TAS3a_siRNA16, TAS3b_siRNA1, and TAS3c_siRNA19 are generated from TAS3a, TAS3b, and TAS3c, respectively. C, Northern blotting to detect TAS3a_siRNA5 in WT, tas3a-1 and tas3a-2, and TAS3b_siRNA1 in WT, tas3b-1 and tas3b-2. U6 was used as an internal control. D, Cumulative abundance of tasiR-ARFs (left side) and TAS3 siRNAs (right side) in WT, tas3a-1, tas3b-1, and tas3c-1. In (B) and (D), “RPM” is short for “reads per million mapped reads.” Significant differences as compared to WT are denoted by *P ≤ 0.05, **P ≤ 0.01, and ***P ≤ 0.001, respectively, with the P-values being derived from unpaired two-tailed t test. siRNA abundance is displayed as mean ± standard deviation of three biological repeats.

