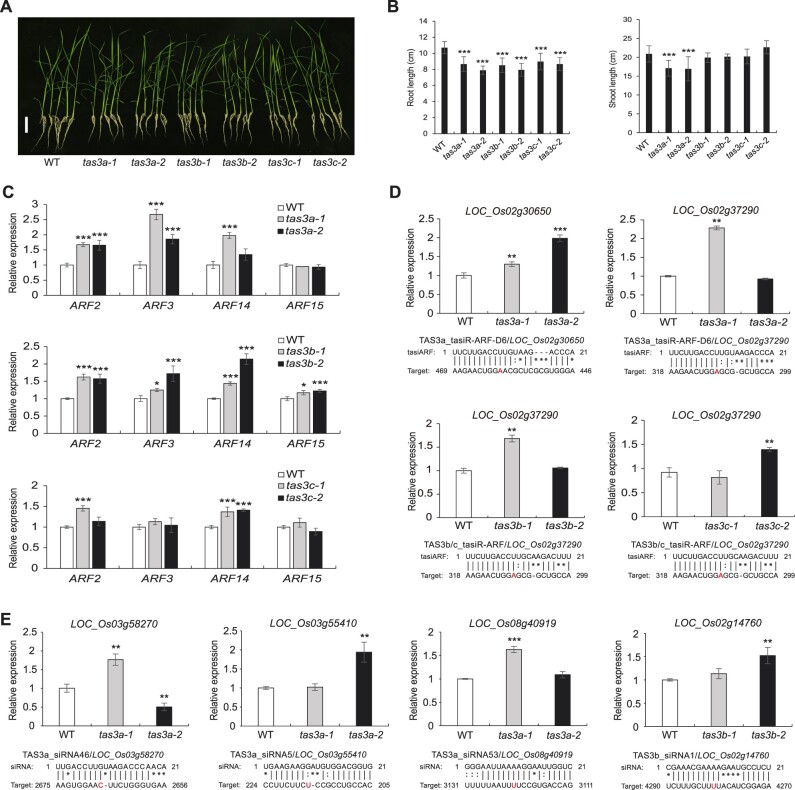
Figure 6.
Morphological and molecular phenotypes of rice tas3 mutants. A, Seven-day-old seedlings of WT and tas3 mutants. Scale bar = 5 cm. B, Statistical analyses of root length and plant height, the latter being defined as the distance from the shoot base to the top, of WT and different tas3 mutants. In (C–E), relative expression of various genes in WT and tas3 mutants was determined by RT-qPCR. UBQ5 was used as an internal control. Significant differences as compared to WT are denoted by *P ≤ 0.05, **P ≤ 0.01, and ***P ≤ 0.001, respectively, with the P-values being derived from unpaired two-tailed t test. The relative expression of target genes is displayed as mean ± standard deviation of three biological repeats. C, Relative expression of the tasiR-ARF targets ARF2/3/14/15. D, Relative expression of two tasiR-ARF target genes. E, Relative expression of four non-tasiR-ARF TAS3 siRNA target genes. In (D and E), the pairing between the siRNAs and the target transcripts is shown below the plots. The letters in red indicate the cleavage positions as revealed by PARE analysis.

