Figure 1.
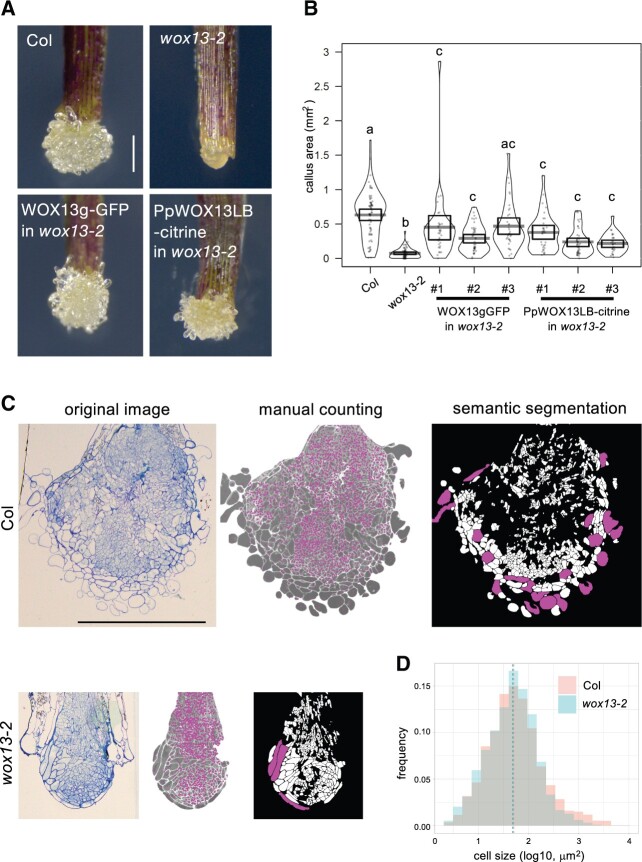
WOX13 promotes callus growth at wound sites. A and B, Wound-induced callus formation assay using leaf petioles. Representative images of calli (A) and quantification of the callus projection area (B) 9 d after cutting of petioles. Gray bars in the pirateplot indicate mean value and boxes indicate 95% highest density intervals. Different letters indicate significant differences based on one-way analysis of variance (ANOVA) with Steel–Dwass test, P < 0.01. C, Semi-thin cross sections of calli, original image (left), after manual cell counting (middle), after X-net segmentation of cells (right). Magenta dots in the middle image indicate individual cells that are manually marked. White regions in the right image indicate individual cells that are automatically recognized by X-net and cells with areas larger than 1,000 µm2 are highlighted by magenta. n = 3. D, Histogram of the callus cell size. Dashed lines indicate median value. n = 3,435 (Col), n = 1,332 (wox13-2). Scale bars, 100 µm (A and C).

