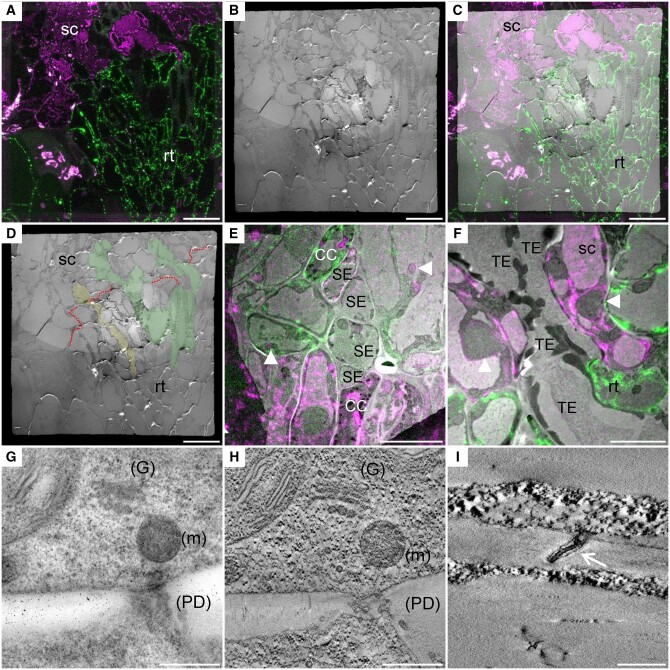
Figure 2.
CLEM as a tool to investigate the ultrastructure of the graft interface. The scion and the rootstock are, respectively, at the top and bottom positions (A–C, E, and F). A, Confocal acquisition of the graft interface of a 35S::HDEL_mRFP scion grafted onto a 35S::HDEL_YFP rootstock. B, Transmission electron micrograph tiles of the regions observed in (A). C, Correlated light electron microscopy view of the graft interface which allows the precise identification of the scion and rootstock cells. D, Thanks to correlative images, the “map” of the graft interface (red dotted line) is made and allows us to identify the scion (sc), the rootstock (rt), phloem sieve element (yellow), and xylem vessels (green). E, Correlated view of sieve elements (SE) and companion cells (CC) aligned at the interface. F, Correlated view of xylem tracheary element (TE) properly aligned at the graft interface. G, Electron micrograph of a cell wall that also shows the Golgi apparatus (G), mitochondria (m), and PD (H) its corresponding tomogram that increases the resolution and shows the preservation of the membranes of the organelles. I, Tomogram showing the PD plasma membrane (white arrow) and the desmotubule membranes. White arrowheads denote “natural landmarks,” i.e. plastids, nuclei, that were used to correlate confocal and transmission electron microscopy images. Scale bars: (A–D) 20 µm, (E) 10 µm, (F) 5 µm, (G and H) 0.5 µm, and (I) 0.2 µm.

