
Figure 5.
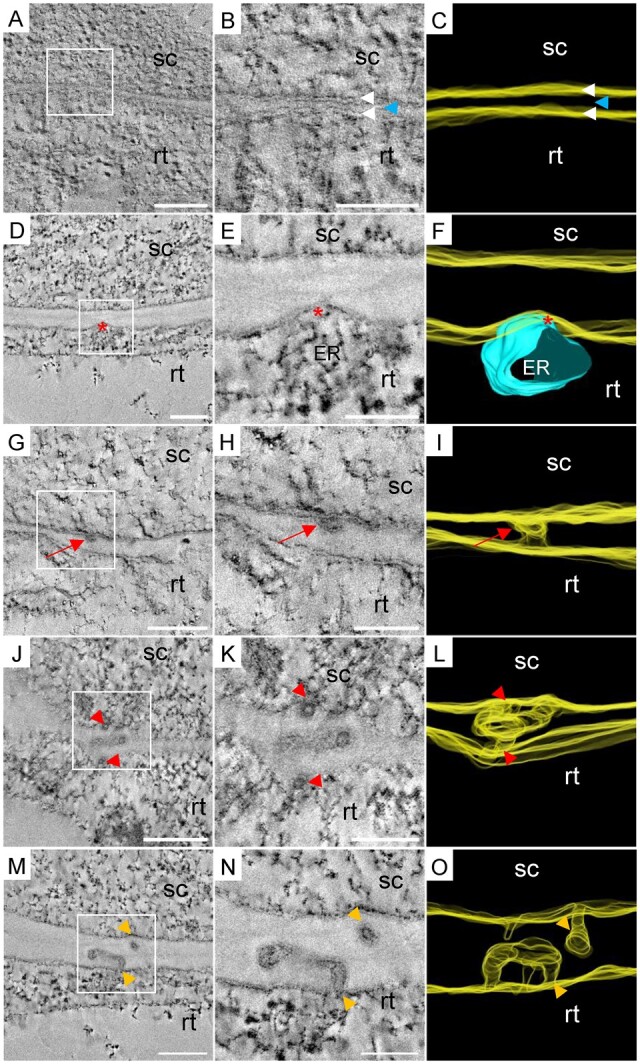
Electron tomograms and 3-D segmentations of PD biogenesis events at the graft interface. The scion (sc) and the rootstock (rt) are, respectively, at the top and bottom positions. A–C, Extreme thinning observed all along the cell wall between two grafted cells. White arrowheads indicate the bilayer of plasma membranes and the blue arrowhead indicates the residual cell wall between them. D–F, Localized thinning of the cell wall at the ER/plasma membrane contact site at the rootstock side (red asterisks). G–I, Simple PD (red arrows) observed in a thin cell wall. J–L, Complex PD in a localized thickening of a thin cell wall (entrances are depicted with red arrowheads). M–O, Hemi-PD facing each other across the graft interface (orange arrowheads). Scale bars: (A, D, G, J, M) 0.2 µm, (B, E, H, K, N) 0.1 µm.