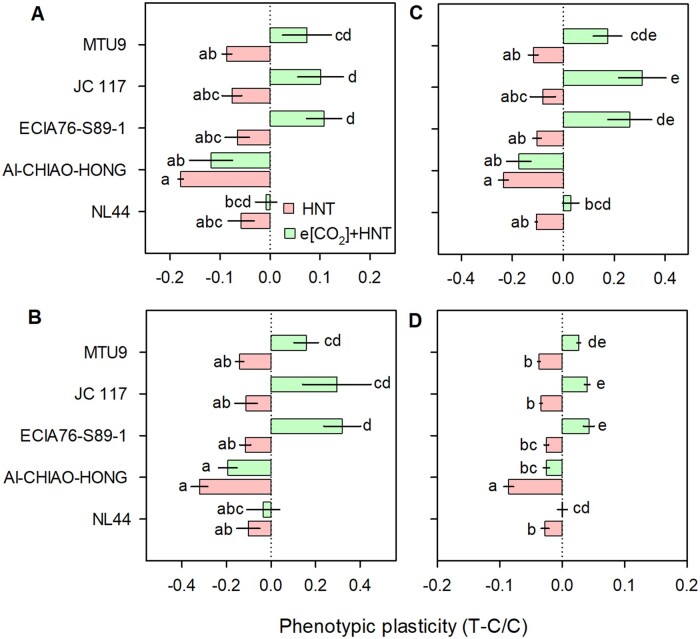
Figure 6.
Summary of phenotypic variation in yield components under HNT and e[CO2] + HNT. Phenotypic plasticity of yield traits viz. main panicle weight (A), grain yield (B), total biomass (C), and TGW (D) in rice genotypes MTU9, JC 117, ECIA76-S89-1 (HCR), AI-CHIAO-HONG (LCR) and NL44 (HST) under HNT (red columns) and e[CO2] + HNT combination (green columns) compared to their respective controls (ambient temperature and ambient [CO2]). Phenotypic plasticity shows relative change between control (C) and treatment (T). Each horizontal column represents mean of five replicates. Bars indicate ± se (standard error of mean). Comparison of means was obtained from Tukey’s honest significant difference test. Means with the same letter are not significantly different at (P < 0.05).

