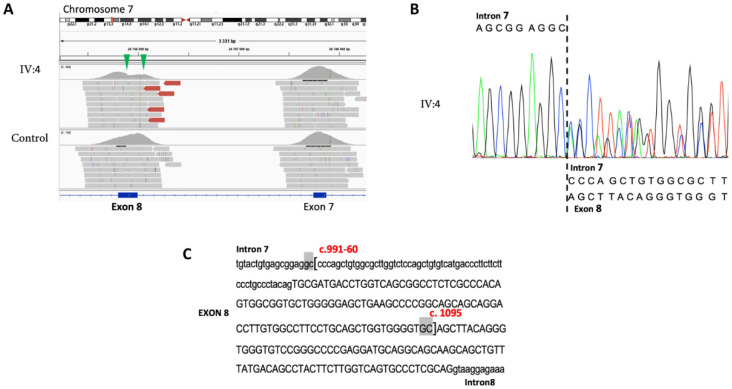
Figure 3.
Identification and validation of the GSDME deletion in the proband IV:4. (A) Integrative genomics viewer screenshot focused on the GSDME exons 8 and 9. The sequence reads from the proband and a control are shown. Green arrowheads indicate the position of the deletion. (B) Sequence chromatogram of the c.991-60_1095del variant. (C) Sequence context of the deletion. The brackets indicate the 5′ and 3′ breakpoints of the deletion. The 2 bp flanking microhomologies are highlighted in gray.

