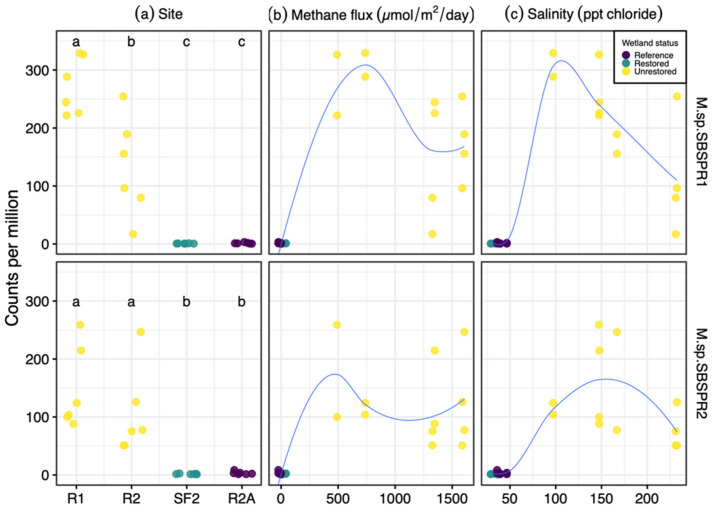
Figure 5.
Abundance of Marivita sp. SBSPR1 and SBSPR2, expressed as counts per million assembled reads, across 24 metagenomic samples from Zhou et al. (2021) [15], organized by (a) site, (b) methane flux, and (c) salinity. Lines from loess functions are shown in (b,c). R1, R2, SF2, and R2A refer to site names as in Zhou et al. (2021). Different letters in (a) denote statistically significant pairwise differences (Nemenyi posthoc test, p < 0.05).

