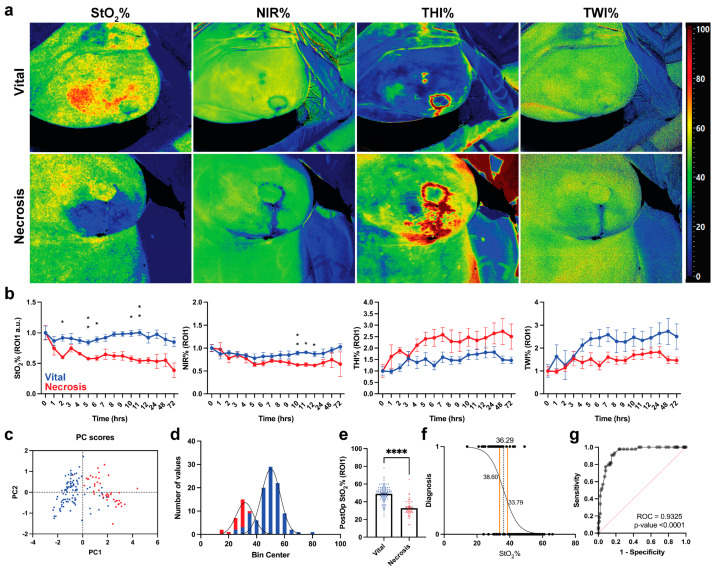
Figure 3.
HSI data analysis for necrotic and vital mastectomy skin flaps. (a) Visualization of every parameter in both groups. (b) Statistical analysis of every parameter in ROI-1. Data are expressed as mean ± SEM and analyzed with One-Way ANOVA mixed effect. p-Value < 0.05 was considered significant. Data are normalized with the respective parameter values immediately after the operation and expressed as fold change. (c) PCA shows that necrotic mastectomy skin flaps are clustered on PC1 positive values. (d) Data distribution of necrotic and vital mastectomy skin flaps. (e) Mann–Whitney U test of StO2% values of necrotic mastectomy skin flaps (n = 47 measurements) versus vital skin flaps (n = 104 measurements) of ROI-1. Data are expressed as mean ± SEM. A two-tailed p-value < 0.05 was considered significant. ****: p < 0.0001. (f) Simple logistic regression of StO2% values according to the following classification: necrotic: 0, vital: 1. (g) ROC of simple logistic regression shown in (f).

