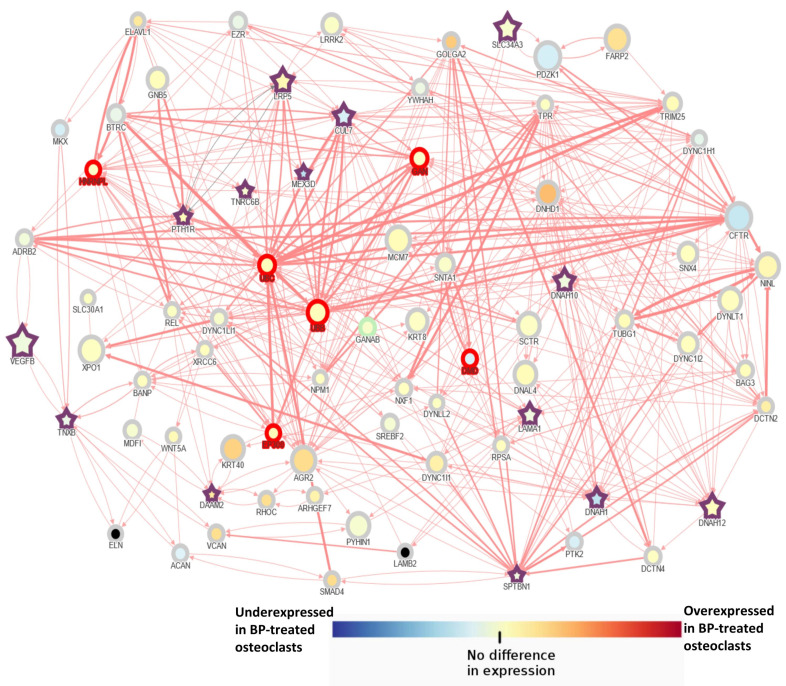
Figure 3.
Network analysis of bone-related genes mutated in at least 2 AFF patients using the AFFNET tool. The shortest path interactions among candidate genes were displayed. Purple stars indicate candidate genes. The size of the nodes is determined by observed/expected loss of function score in the gnomAD database. This score is the ratio of the observed and expected loss of function variants in a particular gene. This score provides insight into how tolerant a gene is to loss of function variation. The red border tags genes that are outlier in the constrain metrics for LoF or missense variants according to gnomAD. Node color represents their expression depending on the expression data obtained in the GSE63009: Osteoclastic precursor cells treated or not with bisphosphonates (alendronate or risedronate) during their differentiation into mature osteoclasts.

