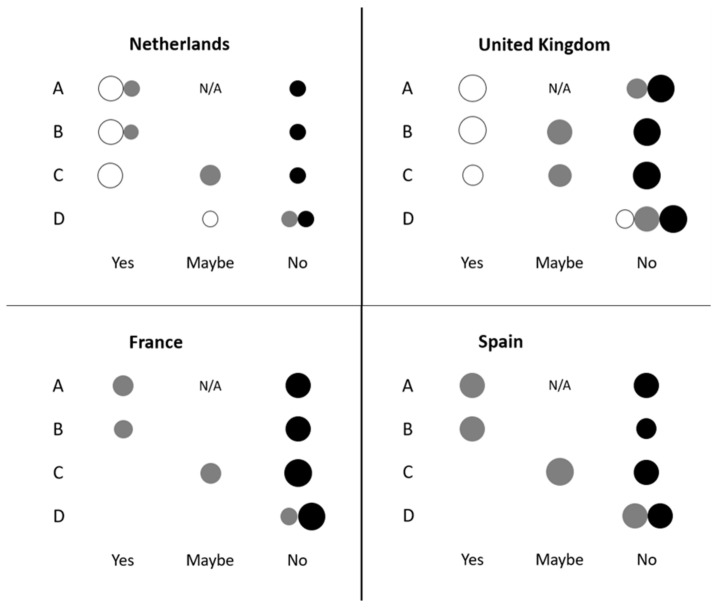
Figure 1.
Cluster analyses with regards to willingness to engage with cultured meat showing the spread among each of the four categorigal variables. The size of the bubbles is indicative of the relative distribution among respondents within each variable. The categorical variables are: A, “If available, would you consider cultured muscle tissue as a source of dietary proteins?”; B, “Would you personally be willing to try cultured meat?”; C, “Would you personally be willing to purchase cultured meat?” and D, “Would you personally be willing to pay more for cultured meat?”. The colours of the bubbles represent the clusters: white = yes, willing, grey = uncertain, black = no, not willing. France, n = 484; Spain, n = 210; The Netherlands, n = 230; and The United Kingdom, n = 366. N/A and all blanks= no association.

