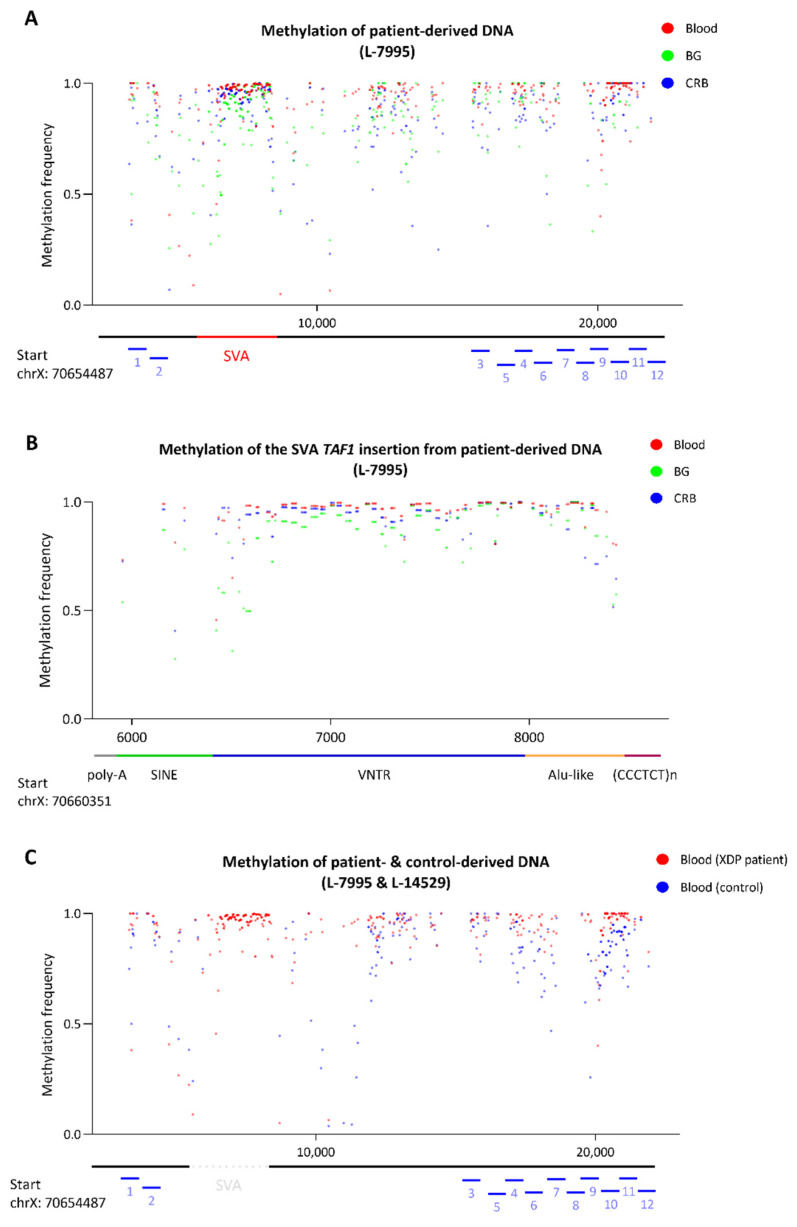
Figure 3.
Methylation frequency of the TAF1 SVA insertion and flanking regions. (A) Methylation frequency of two different brain tissues and blood-derived from a patient with XDP. Red indicates methylation from blood-derived DNA, green from basal ganglia-derived (BG) DNA and blue from cerebellum-derived (CRB) DNA. (B) Methylation frequency of TAF1 SVA insertion with indicated SVA domains of the same patient-derived DNA samples. Red indicates methylation from blood-derived DNA, green from BG-derived DNA and blue from CRB-derived DNA. (C) Methylation frequency of blood-derived DNA from a patient with XDP (red) and a control participant (blue). The x-axis indicates the position in the reference sequence. The bars indicate the location of predicted enhancers, the TAF1 SVA insertion and the insertion’s subunits.

