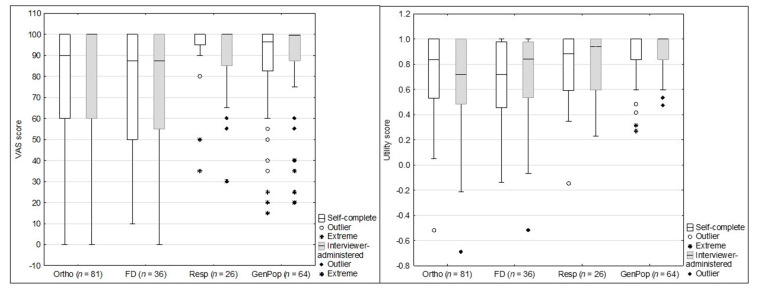
Figure 2.
VAS and utility scores for the self-complete and interviewer-administered versions across known health groups. Boxes indicate first (25th) to third (75th) quartiles, the dividing line indicates the median, whiskers indicate the remaining points up to the length of 1.5 times the interquartile range and markers indicate any remaining outliers.

