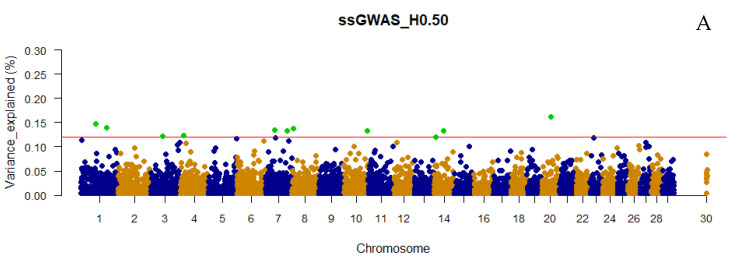
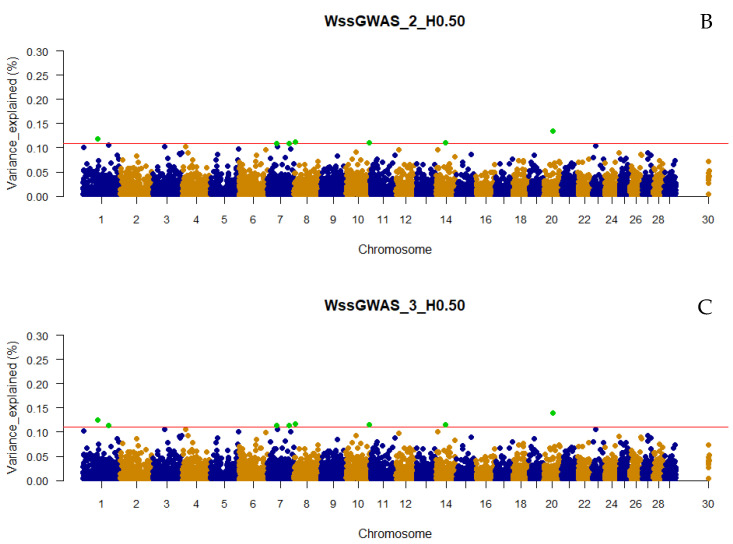
Figure 3.
Manhattan plot of the percentage of the total additive genetic variance explained by haplotypes from haploblocks built with a linkage disequilibrium threshold of 0.50 for yearling temperament in American Angus cattle using single-step GWAS (ssGWAS_H0.50; A) and weighted single-step GWAS in the second (WssGWAS_2_H0.50; B) and third (WssGWAS_3_H0.50; C) iterations. Green points highlighted above the red horizontal line are the top 0.001% markers that explained greater percentages of the total additive genetic variance for YT. The X-chromosome (PAR region) is represented by the chromosome 30.


