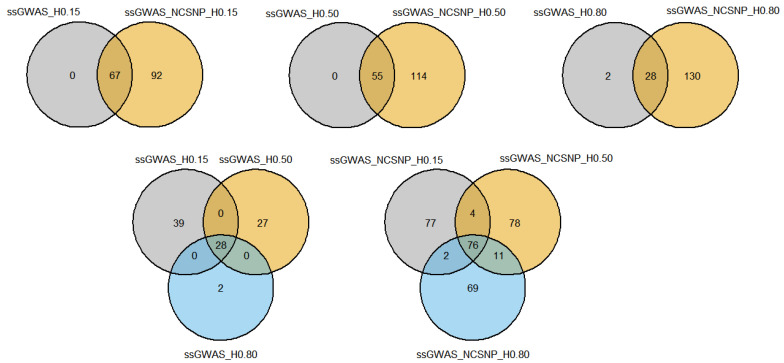
Figure 10.
Venn diagrams showing the number of QTL overlapping among different single-step genome-wide association studies (ssGWAS) with haplotypes and non-clustered SNPs. ssGWAS_H0.15, ssGWAS_H0.50, and ssGWAS_H0.80: ssGWAS using only haplotypes from blocks with linkage disequilibrium (LD) thresholds of 0.15, 0.50, and 0.80, respectively; ssGWAS_NCSNP_H0.15, ssGWAS_NCSNP_H0.50, and ssGWAS_NCSNP_H0.80: ssGWAS using non-clustered SNPs and haplotypes from blocks with LD thresholds of 0.15, 0.50, and 0.80, respectively.

