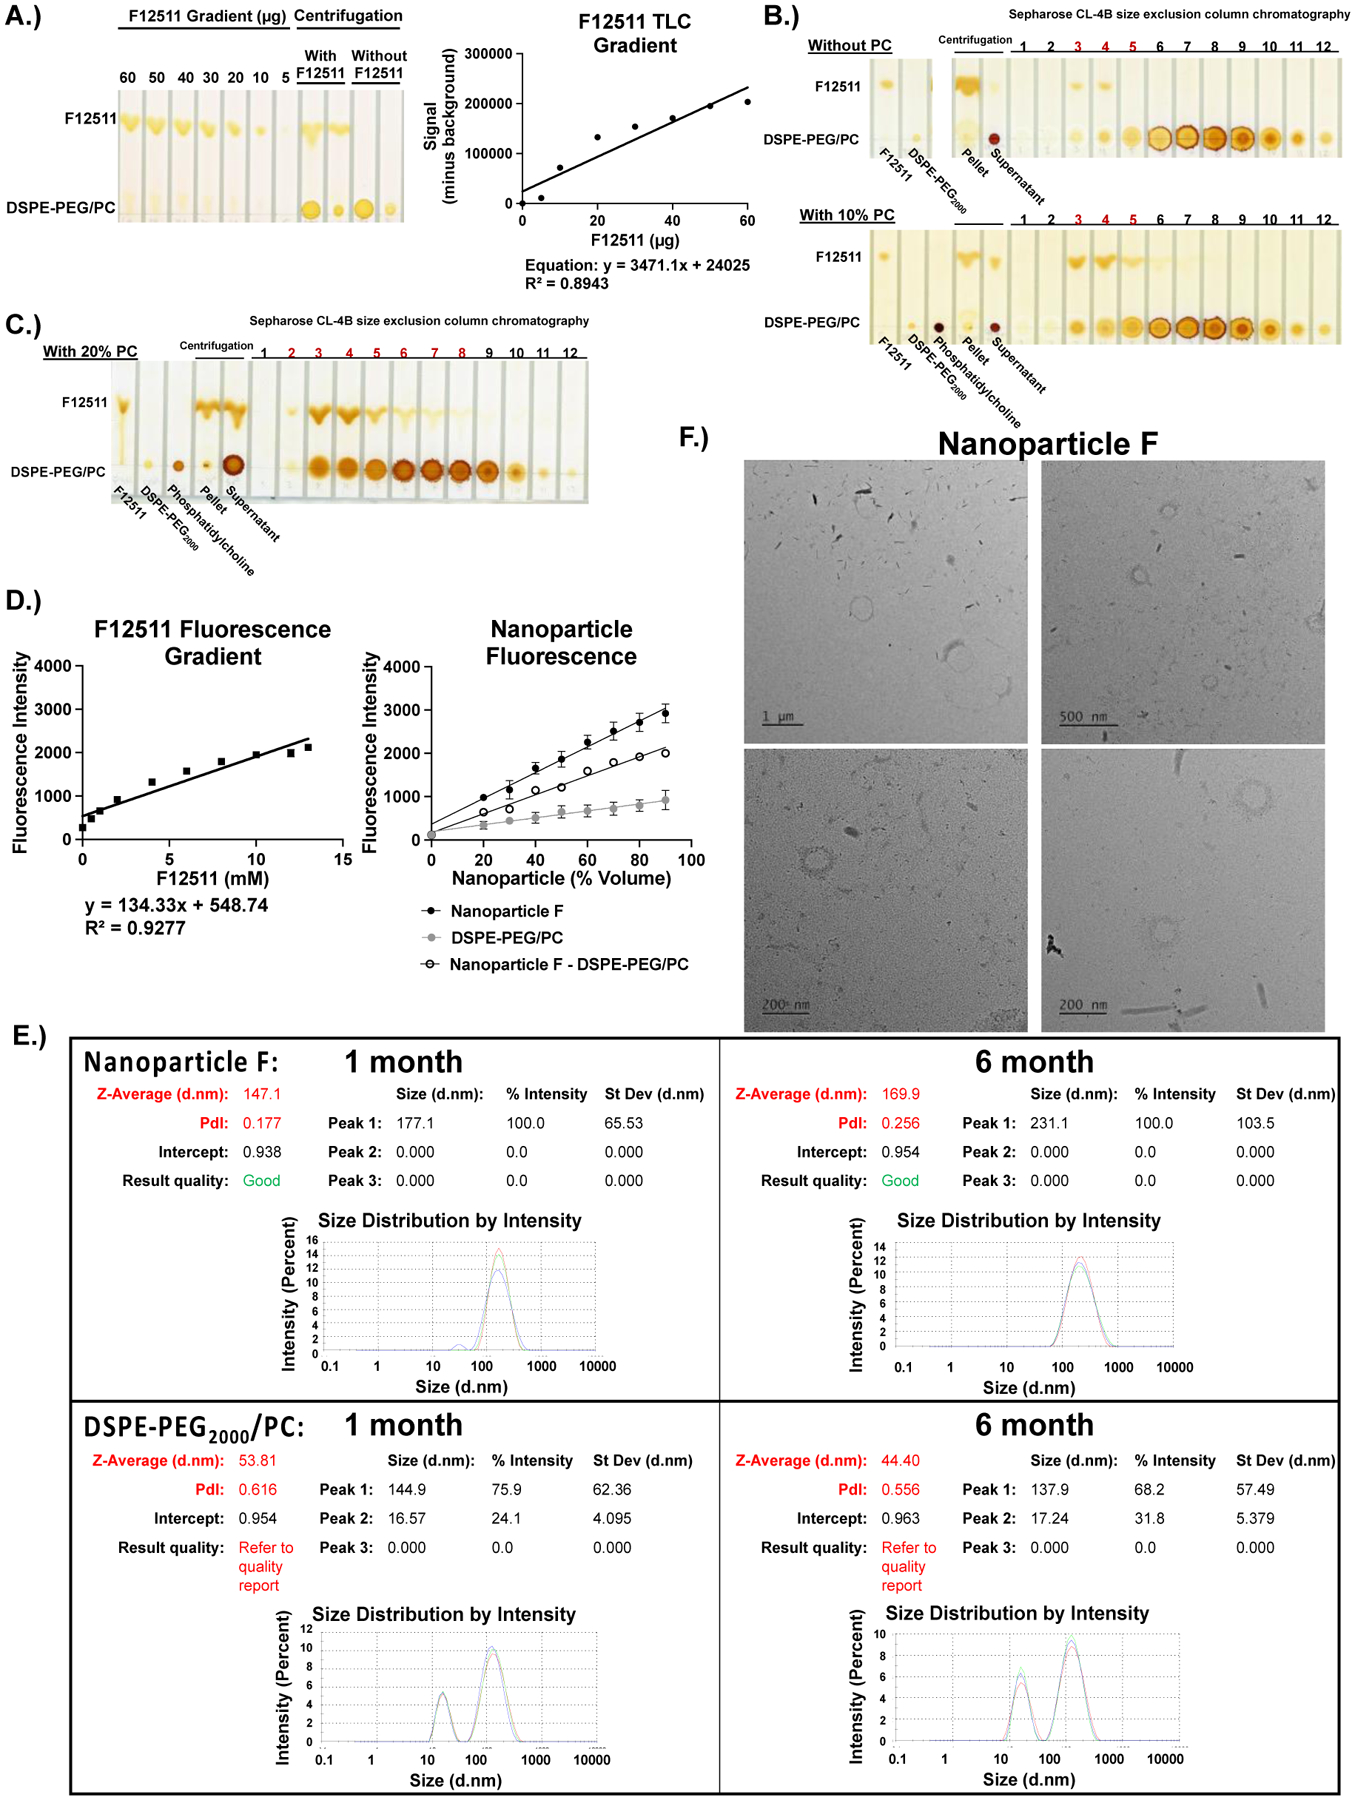
Figure 2:

F12511 DSPE-PEG2000/PC nanoparticles (Nanoparticle F) can be characterized qualitatively by TLC and iodine staining methods, as well as quantitatively by using fluorescence, electron microscopy, and Malvern Zeta Sizer methods. A.) A concentration gradient of F12511 (60–5μg) was used to create a standard curve using ImageJ Software. Based on the generated trendline’s equation, the concentration of F12511 was determined. B and C.) Standards (F12511, DSPE-PEG2000, phosphatidylcholine (PC)), pellet (pelleted precipitate), and supernatant are shown in first lanes. The fractions labeled 1–12 refer to the 500μL elution fractions collected from a size exclusion column (Sepharose CL-4B). The red numbers highlight the elution fractions showing encapsulation of F12511 based on the co-elution of F12511 with DSPE-PEG2000 or DSPE-PEG2000/PC. B.) The top TLC plate shows nanoparticles with only DSPE-PEG2000 (no PC). The bottom TLC plate shows Nanoparticle F with DSPE-PEG2000 and 10% PC. C.) The TLC sample shown here came from the nanoparticle system consisting of 40 mol % F12511 (12mM), 20 mol % PC (6mM), and DSPE-PEG2000 (30mM). D.) Fluorescence intensity curves for F12511 alone (left) and nanoparticles (right). E.) Malvern Zeta Sizer “Size Distribution by Intensity” results for 1- and 6-month-old nanoparticles. Each sample was measured in triplicate. F.) Representative TEM images of Nanoparticle F.
