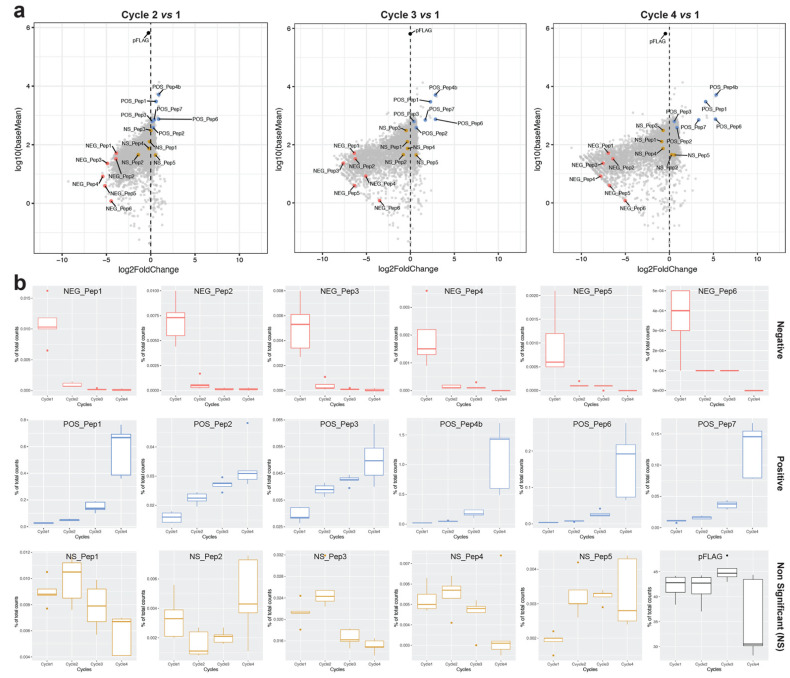
Figure 1.
Performance characteristics of the candidate clones in the bulk experiment. Data are based on the deep sequencing experiment described in [14]. (a) Frequency changes of candidate clones during the growth cycles of the random sequence library in the background of all analyzed clones. Plots are based on the statistical analysis of clone frequency changes with DESeq2 [18], comparing mean counts of clones in the starting library (cycle 1) versus fold-changes at cycles 2, 3 and 4 (4 serial passages) for the deep sequencing experiment in [14] and its reanalysis in [18]. The y-axis shows the average read counts across the replicates (log10 (baseMean)); the x-axis is the relative change in clone frequency (log2FoldChange) at each cycle versus the counts at cycle 1. Candidates that are the focus of this study are highlighted with colored dots. We categorise the candidates into three classes—NEG_Pep = negative (decreased in frequency—padj < 0.05 and negative log2FoldChange value), NS_Pep = neutral (no significant change in frequency—padj > 0.05), POS_Pep = positive (increased frequency—padj < 0.05 and positive log2FoldChange values), and pFLAG = empty plasmid (black dot). Note that the overall effect of the empty plasmid in this experiment is within the range of the effects of the neutral peptides, but this can vary somewhat between experiments [18]. (b) Individual frequency trajectories of the candidate clones during the four cycles of growth. Boxplots show medians with lower and upper hinges corresponding to the 1st and 3rd quartiles.

